


You also want an ePaper? Increase the reach of your titles
YUMPU automatically turns print PDFs into web optimized ePapers that Google loves.
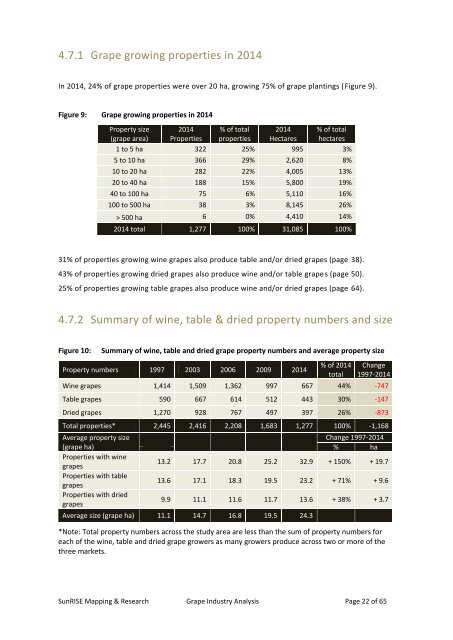
4.7.1 <strong>Grape</strong> growing properties in 2014<br />
In 2014, 24% of grape properties were over 20 ha, growing 75% of grape plantings (Figure 9).<br />
Figure 9: <strong>Grape</strong> growing properties in 2014<br />
Property size 2014 % of total 2014 % of total<br />
(grape area) Properties properties Hectares hectares<br />
1 to 5 ha 322 25% 995 3%<br />
5 to 10 ha 366 29% 2,620 8%<br />
10 to 20 ha 282 22% 4,005 13%<br />
20 to 40 ha 188 15% 5,800 19%<br />
40 to 100 ha 75 6% 5,110 16%<br />
100 to 500 ha 38 3% 8,145 26%<br />
> 500 ha 6 0% 4,410 14%<br />
2014 total 1,277 100% 31,085 100%<br />
31% of properties growing wine grapes also produce table <strong>and</strong>/or dried grapes (page 38).<br />
43% of properties growing dried grapes also produce wine <strong>and</strong>/or table grapes (page 50).<br />
25% of properties growing table grapes also produce wine <strong>and</strong>/or dried grapes (page 64).<br />
4.7.2 Summary of wine, table & dried property numbers <strong>and</strong> size<br />
Figure 10:<br />
Summary of wine, table <strong>and</strong> dried grape property numbers <strong>and</strong> average property size<br />
Property numbers 1997 2003 2006 2009 2014<br />
% of 2014<br />
total<br />
Change<br />
1997-2014<br />
Wine grapes 1,414 1,509 1,362 997 667 44% -747<br />
Table grapes 590 667 614 512 443 30% -147<br />
Dried grapes 1,270 928 767 497 397 26% -873<br />
Total properties* 2,445 2,416 2,208 1,683 1,277 100% -1,168<br />
Average property size<br />
(grape ha)<br />
Properties with wine<br />
grapes<br />
Properties with table<br />
grapes<br />
Properties with dried<br />
grapes<br />
Change 1997-2014<br />
% ha<br />
13.2 17.7 20.8 25.2 32.9 + 150% + 19.7<br />
13.6 17.1 18.3 19.5 23.2 + 71% + 9.6<br />
9.9 11.1 11.6 11.7 13.6 + 38% + 3.7<br />
Average size (grape ha) 11.1 14.7 16.8 19.5 24.3<br />
*Note: Total property numbers across the study area are less than the sum of property numbers <strong>for</strong><br />
each of the wine, table <strong>and</strong> dried grape growers as many growers produce across two or more of the<br />
three markets.<br />
SunRISE Mapping & Research <strong>Grape</strong> <strong>Industry</strong> <strong>Analysis</strong> Page 22 of 65