TRS 2011 Comprehensive Annual Financial Report
TRS 2011 Comprehensive Annual Financial Report
TRS 2011 Comprehensive Annual Financial Report

You also want an ePaper? Increase the reach of your titles
YUMPU automatically turns print PDFs into web optimized ePapers that Google loves.
TEACHER RETIREMENT SYSTEM OF TEXAS COMPREHENSIVE ANNUAL FINANCIAL REPORT <strong>2011</strong><br />
Actuarial Information <strong>TRS</strong>-Care<br />
Actuarial Methods and Assumptions<br />
The actuarial valuation of <strong>TRS</strong>-Care (Retired Plan) is prepared by Gabriel, Roeder, Smith & Company. The actuary relies on membership<br />
data and asset information provided by <strong>TRS</strong> staff. While not verifying the data at their source, the actuary performs such tests<br />
for consistency and reasonableness as deemed necessary to be satisfied with the appropriateness of using the data supplied.<br />
A summary of the actuarial assumptions and methods used by the actuary are as follows:<br />
The projected unit credit method of valuation was used in determining liabilities and normal costs. Differences in the past between<br />
assumed experience and actual experience (“actuarial gains and losses”) become part of the actuarial accrued liabilities. Unfunded<br />
actuarial accrued liabilities are amortized to produce payments (principal and interest) which are level percents of payroll contributions.<br />
A schedule of Funding Progress including a 5-year Summary of Actuarial Accrued Liabilities (AAL) and Unfunded Actuarial Accrued<br />
Liabilities (UAAL) can be found in the Required Supplementary Information found immediately following the Notes to the <strong>Financial</strong><br />
Statements.<br />
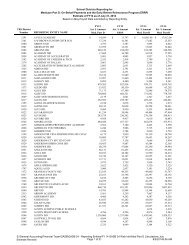
Schedule of Retirees and Beneficiaries Added to and Removed from Rolls<br />
Added to Rolls Removed from Rolls Rolls - End of Year<br />
(1) (8) (9)<br />
Valuation (3) (5) (7) % Increase Average<br />
as of (2) <strong>Annual</strong> (4) <strong>Annual</strong> (6) <strong>Annual</strong> in <strong>Annual</strong> <strong>Annual</strong><br />
August 31 Number Allowances Number Allowances Number Allowances* Allowances Allowances<br />
2008 $ $ 198,968 $ 605,932 252 NA $ 3,045<br />
2009 12,158 54,271,769 8,192 19,365,868 202,934 694,017,558 14.5% 3,420<br />
2010 14,996 71,136,696 7,924 21,837,784 210,006 757,979,912 9.2 3,609<br />
<strong>2011</strong> 20,467 109,331,023 8,019 24,802,618 222,454 898,001,599 18.5 4,037<br />
* Expected employer provided claims and expenses (net of retiree premiums).<br />
<strong>Annual</strong> Allowances in Column (7) include increases due to health care inflation for continuing retirees. Therefore, the annual allowance is not equal to the<br />
beginning of year allowance plus the “Added to Rolls” allowance minus the “Removed from Rolls” allowance.<br />
Solvency Test<br />
A short-term solvency test is one means of checking a post-employment benefit fund’s progress under its funding program. The<br />
following schedule provides a historical illustration of a short-term solvency test for <strong>TRS</strong>-Care wherein present valuation assets are<br />
compared with: (1) active member contributions on deposit; (2) the liabilities for future benefits to members who have retired or<br />
for terminated members with vested benefits; (3) the liabilities for service already rendered by active members.<br />
In a system that has been following the discipline of level contribution rate financing; the liabilities for future benefits for terminated<br />
employees will be fully covered by present assets, except in rare circumstances. The liabilities for services rendered by members<br />
will be at least partially covered by the remainder of present assets. Generally, if the system has been using level contribution rate<br />
financing, the funded portion of liability will increase over time. A decrease generally occurs in those years when substantial benefit<br />
improvements are granted, when full recommended contributions have not been made, or when there are actuarial experience losses.<br />
The funded ratio of the system based on total actuarial accrued liabilities provides an indication of how well the system is funded.<br />
122 ACTUARIAL SECTION