TRS 2011 Comprehensive Annual Financial Report
TRS 2011 Comprehensive Annual Financial Report
TRS 2011 Comprehensive Annual Financial Report

Create successful ePaper yourself
Turn your PDF publications into a flip-book with our unique Google optimized e-Paper software.
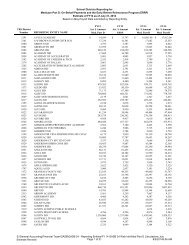
TEACHER RETIREMENT SYSTEM OF TEXAS COMPREHENSIVE ANNUAL FINANCIAL REPORT <strong>2011</strong><br />
1 0 - Y E A R S U M M A R Y<br />
Changes in Fiduciary Net Assets<br />
<strong>TRS</strong>-CARE (RETIRED PLAN)<br />
FOR THE FISCAL YEARS ENDED AUGUST 31<br />
<strong>2011</strong> 2010 2009 2008<br />
Additions:<br />
Health Care Premiums $ 345,164,271 $ 332,481,933 $ 329,723,191 $ 328,505,433<br />
State Contributions 282,782,431 279,250,547 267,471,299 254,722,174<br />
Member Contributions 183,808,580 181,512,856 173,856,344 165,569,413<br />
<strong>Report</strong>ing Entities Contributions 158,724,010 155,918,241 149,562,613 141,672,630<br />
On Behalf Fringe Benefits Paid by<br />
the State 108,440 101,511 95,929 91,945<br />
Federal Revenue 136,887,805 70,795,686 61,530,735 59,486,239<br />
Investment Income 8,168,640 11,679,229 17,482,143 29,252,347<br />
Legislative Appropriations Transfer<br />
from <strong>TRS</strong>-ActiveCare<br />
TOTAL ADDITIONS $ 1,115,644,177 $ 1,031,740,003 $ 999,722,254 $ 979,300,181<br />
Deductions:<br />
Health Care Claims $ 992,478,380 $ 971,356,805 $ 885,132,865 $ 833,509,538<br />
Health Care Claims Processing 44,115,872 42,535,601 40,364,063 36,747,710<br />
Administrative Expenses, Excluding<br />
Investing Activity Expenses 3,143,922 3,031,686 2,916,259 3,000,536<br />
Legislative Appropriations Transfer<br />
to <strong>TRS</strong>-ActiveCare<br />
TOTAL DEDUCTIONS $ 1,039,738,174 $ 1,016,924,092 $ 928,413,187 $ 873,257,784<br />
Net Increase (Decrease) $ 75,906,003 $ 14,815,911 $ 71,309,067 $ 106,042,397<br />
Net Assets - Beginning of Year $ 814,964,303 $ 800,148,392 $ 728,839,325 $ 622,796,928<br />
Restatements<br />
<strong>Financial</strong> Trends Information<br />
Beginning of Year, As Restated $ 814,964,303 $ 800,148,392 $ 728,839,325 $ 622,796,928<br />
Net Assets - End of Year $ 890,870,306 $ 814,964,303 $ 800,148,392 $ 728,839,325<br />
130 STATISTICAL SECTION