TRS 2011 Comprehensive Annual Financial Report
TRS 2011 Comprehensive Annual Financial Report
TRS 2011 Comprehensive Annual Financial Report

Create successful ePaper yourself
Turn your PDF publications into a flip-book with our unique Google optimized e-Paper software.
TEACHER RETIREMENT SYSTEM OF TEXAS COMPREHENSIVE ANNUAL FINANCIAL REPORT <strong>2011</strong><br />
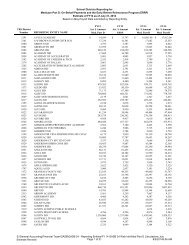
Comparative Schedule of Investing<br />
Activity Expenses<br />
PENSION TRUST FUND<br />
FOR THE FISCAL YEAR ENDED AUGUST 31, <strong>2011</strong> (With Comparative Data for August 31, 2010)<br />
<strong>2011</strong> 2010<br />
S C H E D U L E 3<br />
Direct Expenses:<br />
Salaries and Other Personnel Costs $ 29,476,277 $ 16,283,310<br />
Professional Fees and Services 3,767,718 5,232,615<br />
Consumable Supplies 35,633 41,972<br />
Travel 506,220 490,522<br />
Building Lease 1,019,436 1,486,486<br />
Copier Rentals 75,000 74,039<br />
Dues, Fees and Staff Development 27,648 41,146<br />
Subscriptions and Reference Materials 36,796 40,989<br />
Reproduction and Printing Services 12,721<br />
Software Upgrades 150,796 196,123<br />
Telecommunication and Data Services 322,907 357,760<br />
Furniture and Equipment - Expensed 40,086 246,601<br />
Depreciation - Leasehold Improvements 516,031 516,031<br />
Total Direct Expenses $ 35,987,269 $ 25,007,594<br />
Indirect Expenses:<br />
Depreciation $ 200,523 $ 173,164<br />
Executive Management Support 1,030,719 827,413<br />
Legal Support 1,515,794 1,585,381<br />
Audit Support 761,710 1,442,557<br />
Human Resources Support 609,223 558,432<br />
Fiscal Management Support 1,531,627 1,505,945<br />
Information Technology Support 2,339,344 2,643,578<br />
Staff Services Support 1,057,415 1,191,293<br />
Other Support Services 382,096 408,159<br />
Total Indirect Expenses $ 9,428,451 $ 10,335,922<br />
Total Internal Administrative<br />
Investing Activity Expenses* $ 45,415,720 $ 35,343,516<br />
External Manager Fees ** $ 137,954,055 $ 76,575,138<br />
Total Investing Activity Expenses (Exh. II) *** $ 183,369,775 $ 111,918,654<br />
* Not netted against or included in performance calculations.<br />
** Performance calculations net of External Manager Fees<br />
*** The investing activity expenses do not include the following expenditures:<br />
During fiscal year <strong>2011</strong>, the system paid commissions to various brokers totaling $58,304,167. A portion of the total commissions was paid<br />
to soft dollar brokers generating $6,516,399 of soft dollar credits. Soft dollar credits were spent during fiscal year <strong>2011</strong> in accordance with<br />
Section 28(e) of the Securities Exchange Act of 1934 totaling $6,155,201. Unspent soft dollar credits (totaling $2,428,236) are held by the<br />
receiving broker and will be utilized in the new fiscal year. Another portion of the total commissions was paid through various Commission<br />
Sharing Arrangements (CSA) generating $11,036,887 in CSA proceeds. These proceeds were used to acquire research services from<br />
various investment related firms totaling $14,536,387. Unspent CSA proceeds (totaling $6,396,266) are held by either State Street Bank<br />
and Trust Company as the system’s CSA agent or by the CSA broker as a reserve for future expenses.<br />
Through its contractual agreements with various firms, the system benefited from $6,773,218 in vendor paid expenses and contractual<br />
allowances. Vendor paid expenses are legal arrangements that are used to acquire investment related items other than those paid for with<br />
Soft Dollar credits and CSA proceeds.<br />
In addition to the commission expenses mentioned above, $416,378,165 was paid to various Alternative and Pooled Investment General<br />
Partners for a total of $474,712,229 in fees and commissions which are not included in Investing Activities Expense on Exhibit II. These<br />
amounts are reported in the Schedule of Fees and Commissions and are netted against investment performance on Exhibit II in the<br />
Net Appreciation in Fair Value of Investments amount. Custodial management fees were netted against income from securities lending<br />
activities.<br />
78 FINANCIAL SECTION