TRS 2011 Comprehensive Annual Financial Report
TRS 2011 Comprehensive Annual Financial Report
TRS 2011 Comprehensive Annual Financial Report

You also want an ePaper? Increase the reach of your titles
YUMPU automatically turns print PDFs into web optimized ePapers that Google loves.
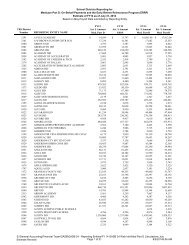
TEACHER RETIREMENT SYSTEM OF TEXAS COMPREHENSIVE ANNUAL FINANCIAL REPORT <strong>2011</strong><br />
<strong>Financial</strong> Trends Information<br />
Revenues, Expenses, and Changes in Net Assets<br />
<strong>TRS</strong>-ACTIVECARE (ACTIVE PLAN) *<br />
FOR THE FISCAL YEARS ENDED AUGUST 31<br />
<strong>2011</strong> 2010 2009 2008<br />
1 0 - Y E A R S U M M A R Y<br />
Revenues<br />
Health Care Premiums $ 1,549,530,891 $ 1,329,171,411 $ 1,172,011,048 $ 1,096,537,022<br />
Administrative Fees 135,917 125,321 187,813 186,844<br />
Investment Income 3,387,062 6,421,269 11,597,992 21,164,640<br />
Federal Revenue ARRA - Cobra<br />
Reimbursements** 667,746 1,225,158 170,219<br />
On Behalf Fringe Benefits Paid by<br />
the State 67,373 64,328 64,975 61,894<br />
Legislative Appropriations Transfer<br />
From <strong>TRS</strong>-Care (Retired Plan)<br />
State Contributions<br />
TOTAL REVENUES $ 1,553,788,989 $ 1,337,007,487 $ 1,184,032,047 $ 1,117,950,400<br />
Expenses<br />
Health Care Claims $ 1,510,090,981 $ 1,313,114,197 $ 1,122,646,958 $ 952,156,339<br />
Health Care Claims Processing 76,960,951 67,906,654 60,934,432 54,583,499<br />
Premium Payments to HMOs 76,270,706 64,532,253 64,820,440 68,204,743<br />
Administrative Expenses 2,207,051 1,883,148 1,861,949 1,830,258<br />
Legislative Appropriations Transfer<br />
to <strong>TRS</strong>-Care (Retired Plan)<br />
TOTAL EXPENSES $ 1,665,529,689 $ 1,447,436,252 $ 1,250,263,779 $ 1,076,774,839<br />
Change in Net Assets $ (111,740,700) $ (110,428,765) $ (66,231,732) $ 41,175,561<br />
Net Assets - Beginning of Year $ 299,810,127 $ 410,238,892 $ 476,470,624 $ 435,295,063<br />
Restatements<br />
Beginning of Year, As Restated $ 299,810,127 $ 410,238,892 $ 476,470,624 $ 435,295,063<br />
Net Assets - End of Year $ 188,069,427 $ 299,810,127 $ 410,238,892 $ 476,470,624<br />
* The <strong>TRS</strong>-ActiveCare Plan, enacted by H.B. 3343, 77th Legislature, began operations in fiscal year 2003 and is accounted for as a proprietary<br />
fund. Prior to fiscal year 2003, <strong>TRS</strong> accounted for <strong>TRS</strong>-ActiveCare (Active Plan) as a fiduciary fund. The net assets of the Active Plan were<br />
transferred to <strong>TRS</strong>-ActiveCare on September 1, 2002.<br />
** The American Recovery and Reinvestment Act (ARRA) of 2009 which was signed into law on February 17, 2009 was created to preserve<br />
jobs and promote economic recovery.<br />
132 STATISTICAL SECTION