TRS 2011 Comprehensive Annual Financial Report
TRS 2011 Comprehensive Annual Financial Report
TRS 2011 Comprehensive Annual Financial Report

Create successful ePaper yourself
Turn your PDF publications into a flip-book with our unique Google optimized e-Paper software.
TEACHER RETIREMENT SYSTEM OF TEXAS COMPREHENSIVE ANNUAL FINANCIAL REPORT <strong>2011</strong><br />
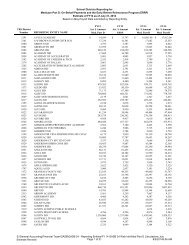
Retired Members by Type of Benefit<br />
PENSION TRUST FUND<br />
AS OF AUGUST 31, <strong>2011</strong><br />
Number<br />
Amount of of Type of Retirement a<br />
Monthly<br />
Retired<br />
Benefit Members 1 2 3 4 5 6 7<br />
$ 1 - 200 12,890 4,847 6,555 321 1,063 53 37 14<br />
$ 201 - 400 33,923 8,399 11,715 651 1,832 1,052 766 9,508<br />
$ 401 - 600 21,855 9,774 8,326 1,336 1,879 276 264 0<br />
$ 601 - 800 19,331 10,734 5,084 1,338 1,556 340 279 0<br />
$ 801 - 1,000 18,448 11,945 3,494 1,052 1,388 354 215 0<br />
$ 1,001 - 1,200 16,077 11,145 2,511 772 1,197 291 161 0<br />
$ 1,201 - 1,400 13,901 9,440 2,300 635 1,181 225 120 0<br />
$ 1,401 - 1,600 14,663 9,927 2,751 576 1,071 241 97 0<br />
$ 1,601 - 1,800 15,039 10,635 2,651 508 923 230 92 0<br />
$ 1,801 - 2,000 15,924 12,065 2,375 413 781 236 54 0<br />
$ over 2,000 130,629 113,834 8,817 1,257 5,379 1,239 103 0<br />
Totals 312,680 212,745 56,579 8,859 18,250 4,537 2,188 9,522<br />
a<br />
Type of Retirement:<br />
1 - Normal Retirement of Age and Service<br />
2 - Early Retirement<br />
3 - Disability Retirement<br />
4 - Survivor Payment, Joint Life or Guarantee<br />
5 - Survivor Payment, Death in Service<br />
6 - Survivor Payment, After Disability Retirement<br />
7 - Survivor Payment, After Service Retirement<br />
Operating Information<br />
Health Care Claims<br />
by Benefit Range<br />
<strong>TRS</strong>-CARE (RETIRED PLAN)<br />
AS OF AUGUST 31, <strong>2011</strong><br />
Benefit<br />
Range<br />
Average<br />
Participants<br />
$ 0 27,375<br />
$ 1 - 5,000 134,135<br />
$ 5,001 - 10,000 29,365<br />
$ 10,001 - 20,000 11,373<br />
$ 20,001 - 30,000 3,009<br />
$ 30,001 - 40,000 1,413<br />
$ 40,001 - 50,000 943<br />
$ 50,001 - 100,000 1,671<br />
$ over 100,000 1,069<br />
Total 210,353<br />
Health Care Claims<br />
by Benefit Range<br />
<strong>TRS</strong>-ACTIVECARE (ACTIVE PLAN)<br />
AS OF AUGUST 31, <strong>2011</strong><br />
Benefit<br />
Range<br />
Average<br />
Participants<br />
$ 0 62,192<br />
$ 1 - 5,000 294,597<br />
$ 5,001 - 10,000 28,299<br />
$ 10,001 - 20,000 14,293<br />
$ 20,001 - 30,000 4,973<br />
$ 30,001 - 40,000 2,430<br />
$ 40,001 - 50,000 1,612<br />
$ 50,001 - 100,000 2,578<br />
$ over 100,000 1,411<br />
Total 412,385<br />
140 STATISTICAL SECTION