TRS 2011 Comprehensive Annual Financial Report
TRS 2011 Comprehensive Annual Financial Report
TRS 2011 Comprehensive Annual Financial Report

Create successful ePaper yourself
Turn your PDF publications into a flip-book with our unique Google optimized e-Paper software.
TEACHER RETIREMENT SYSTEM OF TEXAS COMPREHENSIVE ANNUAL FINANCIAL REPORT <strong>2011</strong><br />
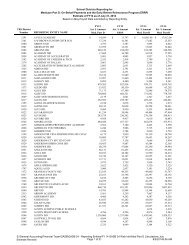
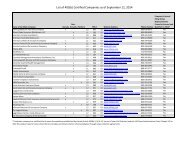
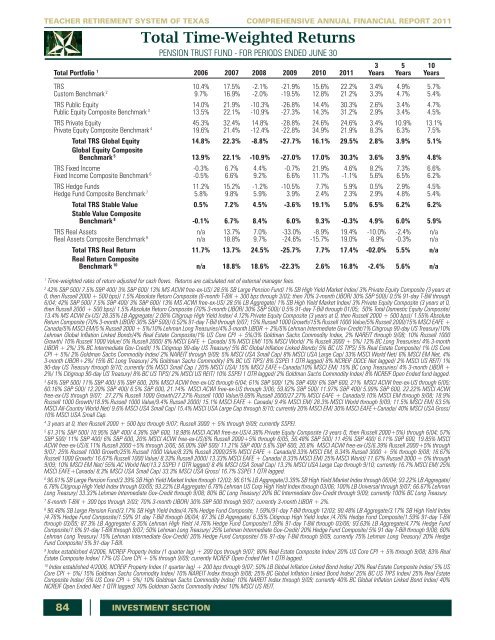
Total Time-Weighted Returns<br />
PENSION TRUST FUND - FOR PERIODS ENDED JUNE 30<br />
3 5 10<br />
Total Portfolio 1 2006 2007 2008 2009 2010 <strong>2011</strong> Years Years Years<br />
<strong>TRS</strong> 10.4% 17.5% -2.1% -21.9% 15.6% 22.2% 3.4% 4.9% 5.7%<br />
Custom Benchmark 2 9.7% 16.9% -2.0% -19.5% 12.8% 21.2% 3.3% 4.7% 5.4%<br />
<strong>TRS</strong> Public Equity 14.0% 21.9% -10.3% -26.8% 14.4% 30.3% 2.6% 3.4% 4.7%<br />
Public Equity Composite Benchmark 3 13.5% 22.1% -10.9% -27.3% 14.3% 31.2% 2.9% 3.4% 4.5%<br />
<strong>TRS</strong> Private Equity 45.3% 32.4% 14.8% -28.8% 24.6% 24.6% 3.4% 10.9% 13.1%<br />
Private Equity Composite Benchmark 4 19.6% 21.4% -12.4% -22.8% 34.9% 21.9% 8.3% 6.3% 7.5%<br />
Total <strong>TRS</strong> Global Equity 14.8% 22.3% -8.8% -27.7% 16.1% 29.5% 2.8% 3.9% 5.1%<br />
Global Equity Composite<br />
Benchmark 5 13.9% 22.1% -10.9% -27.0% 17.0% 30.3% 3.6% 3.9% 4.8%<br />
<strong>TRS</strong> Fixed Income -0.3% 6.7% 4.4% -0.7% 21.9% 4.6% 8.2% 7.3% 6.6%<br />
Fixed Income Composite Benchmark 6 -0.5% 6.6% 9.2% 6.6% 11.7% -1.1% 5.6% 6.5% 6.2%<br />
<strong>TRS</strong> Hedge Funds 11.2% 15.2% -1.2% -10.5% 7.7% 5.9% 0.5% 2.9% 4.5%<br />
Hedge Fund Composite Benchmark 7 5.8% 9.8% 5.9% 3.9% 2.4% 2.3% 2.9% 4.8% 5.4%<br />
Total <strong>TRS</strong> Stable Value 0.5% 7.2% 4.5% -3.6% 19.1% 5.0% 6.5% 6.2% 6.2%<br />
Stable Value Composite<br />
Benchmark 8 -0.1% 6.7% 8.4% 6.0% 9.3% -0.3% 4.9% 6.0% 5.9%<br />
<strong>TRS</strong> Real Assets n/a 13.7% 7.0% -33.0% -8.9% 19.4% -10.0% -2.4% n/a<br />
Real Assets Composite Benchmark 9 n/a 18.8% 9.7% -24.6% -15.7% 19.0% -8.9% -0.3% n/a<br />
Total <strong>TRS</strong> Real Return 11.7% 13.7% 24.5% -25.7% 7.7% 17.4% -02.0% 5.5% n/a<br />
Real Return Composite<br />
Benchmark 10 n/a 18.8% 18.6% -22.3% 2.6% 16.8% -2.4% 5.6% n/a<br />
1<br />
Time-weighted rates of return adjusted for cash flows. Returns are calculated net of external manager fees.<br />
2<br />
42% S&P 500/ 7.5% S&P 400/ 3% S&P 600/ 13% MS ACWI free-ex-US/ 28.5% SB Large Pension Fund/ 1% SB High Yield Market Index/ 3% Private Equity Composite (3 years at<br />
0, then Russell 2000 + 500 bps)/ 1.5% Absolute Return Composite (6-month T-Bill + 300 bps through 3/03; then 70% 3-month LIBOR/ 30% S&P 500)/ 0.5% 91-day T-Bill through<br />
6/04; 42% S&P 500/ 7.5% S&P 400/ 3% S&P 600/ 13% MS ACWI free-ex-US/ 28.5% LB Aggregate/ 1% SB High Yield Market Index/ 3% Private Equity Composite (3 years at 0,<br />
then Russell 2000 + 500 bps)/ 1.5% Absolute Return Composite (70% 3-month LIBOR/ 30% S&P 500)/ 0.5% 91-day T-Bill through 01/05; 50% Total Domestic Equity Composite/<br />
13.4% MS ACWI Ex-US/ 28.35% LB Aggregate/ 2.06% Citigroup High Yield Index/ 4.12% Private Equity Composite (3 years at 0, then Russell 2000 + 500 bps)/ 1.55% Absolute<br />
Return Composite (70% 3-month LIBOR/ 30% S&P 500)/ 0.52% 91-day T-Bill through 9/07; 15% Russell 1000 Growth/15% Russell 1000 Value/5% Russell 2000/15% MSCI EAFE +<br />
Canada/5% MSCI EM/5 % Russell 3000 + 5%/10% Lehman Long Treasuries/4% 3-month LIBOR + 2%/5% Lehman Intermediate Gov-Credit/1% Citigroup 90-day US Treasury/10%<br />
Lehman Global Inflation Linked Bonds/4% Real Estate Composite/1% US Core CPI + 5%/3% Goldman Sachs Commodity Index, 2% NAREIT through 9/08; 10% Russell 1000<br />
Growth/ 10% Russell 1000 Value/ 5% Russell 2000/ 8% MSCI EAFE + Canada/ 5% MSCI EM/ 15% MSCI World/ 7% Russell 3000 + 5%/ 12% BC Long Treasuries/ 4% 3-month<br />
LIBOR + 2%/ 3% BC Intermediate Gov-Credit/ 1% Citigroup 90-day US Treasury/ 5% BC Global Inflation Linked Bonds/ 5% BC US TIPS/ 5% Real Estate Composite/ 1% US Core<br />
CPI + 5%/ 2% Goldman Sachs Commodity Index/ 2% NAREIT through 9/09; 5% MSCI USA Small Cap/ 8% MSCI USA Large Cap/ 33% MSCI World Net/ 6% MSCI EM Net, 4%<br />
3-month LIBOR+2%/ 15% BC Long Treasury/ 2% Goldman Sachs Commodity/ 8% BC US TIPS/ 8% SSPEI 1 QTR lagged/ 8% NCREIF ODCE Net lagged/ 2% MSCI US REIT/ 1%<br />
90-day US Treasury through 9/10; currently 5% MSCI Small Cap / 20% MSCI USA/ 15% MSCI EAFE+Canada/10% MSCI EM/ 15% BC Long Treasuries/ 4% 3-month LIBOR +<br />
2%/ 1% Citigroup 90-day US Treasury/ 8% BC US TIPS/ 2% MSCI US REIT/ 10% SSPEI 1 QTR lagged/ 2% Goldman Sachs Commodity Index/ 8% NCREIF Open Ended fund lagged.<br />
3<br />
64% S&P 500/ 11% S&P 400/ 5% S&P 600, 20% MSCI ACWI free-ex-US through 6/04; 61% S&P 500/ 12% S&P 400/ 6% S&P 600, 21% MSCI ACWI free-ex-US through 6/05;<br />
60.16% S&P 500/ 12.20% S&P 400/ 6.5% S&P 600, 21.14% MSCI ACWI free-ex-US through 3/06; 59.82% S&P 500/ 11.97% S&P 400/ 5.99% S&P 600, 22.22% MSCI ACWI<br />
free-ex-US through 9/07; 27.27% Russell 1000 Growth/27.27% Russell 1000 Value/9.09% Russell 2000/27.27% MSCI EAFE + Canada/9.10% MSCI EM through 9/08; 18.9%<br />
Russell 1000 Growth/18.9% Russell 1000 Value/9.4% Russell 2000/ 15.1% MSCI EAFE + Canada/ 9.4% MSCI EM/ 28.3% MSCI World through 9/09; 11.5% MSCI EM/ 63.5%<br />
MSCI All-Country World Net/ 9.6% MSCI USA Small Cap/ 15.4% MSCI USA Large Cap through 9/10; currently 20% MSCI EM/ 30% MSCI EAFE+Canada/ 40% MSCI USA Gross/<br />
10% MSCI USA Small Cap.<br />
4<br />
3 years at 0, then Russell 2000 + 500 bps through 9/07; Russell 3000 + 5% through 9/09; currently SSPEI.<br />
5<br />
61.31% S&P 500/ 10.95% S&P 400/ 4.38% S&P 600, 18.98% MSCI ACWI free-ex-US/4.38% Private Equity Composite (3 years 0, then Russell 2000+5%) through 6/04; 57%<br />
S&P 500/ 11% S&P 400/ 6% S&P 600, 20% MSCI ACWI free-ex-US/6% Russell 2000+5% through 6/05, 56.48% S&P 500/ 11.45% S&P 400/ 6.11% S&P 600, 19.85% MSCI<br />
ACWI free-ex-US/6.11% Russell 2000+5% through 3/06; 56.00% S&P 500/ 11.21% S&P 400/ 5.6% S&P 600, 20.8% MSCI ACWI free-ex-US/6.39% Russell 2000+5% through<br />
9/07; 25% Russell 1000 Growth/25% Russell 1000 Value/8.33% Russell 2000/25% MSCI EAFE + Canada/8.33% MSCI EM, 8.34% Russell 3000 + 5% through 9/08; 16.67%<br />
Russell 1000 Growth/ 16.67% Russell 1000 Value/ 8.33% Russell 2000/ 13.33% MSCI EAFE + Canada/ 8.33% MSCI EM/ 25% MSCI World/ 11.67% Russell 3000 + 5% through<br />
9/09; 10% MSCI EM Net/ 55% AC World Net/13.3 SSPEI 1 QTR lagged/ 8.4% MSCI USA Small Cap/ 13.3% MSCI USA Large Cap through 9/10; currently 16.7% MSCI EM/ 25%<br />
MSCI EAFE+Canada/ 8.3% MSCI USA Small Cap/ 33.3% MSCI USA Gross/ 16.7% SSPEI 1 QTR lagged.<br />
6<br />
96.61% SB Large Pension Fund/3.39% SB High Yield Market Index through 12/03; 96.61% LB Aggregate/3.39% SB High Yield Market Index through 06/04; 93.22% LB Aggregate/<br />
6.78% Citigroup High Yield Index through 03/05; 93.22% LB Aggregate/ 6.78% Lehman US Corp High Yield Index through 03/06; 100% LB Universal through 9/07; 66.67% Lehman<br />
Long Treasury/ 33.33% Lehman Intermediate Gov-Credit through 9/08; 80% BC Long Treasury/ 20% BC Intermediate Gov-Credit through 9/09; currently 100% BC Long Treasury.<br />
7<br />
6-month T-Bill + 300 bps through 3/03; 70% 3-month LIBOR/ 30% S&P 500 through 9/07; currently 3-month LIBOR + 2%.<br />
8<br />
90.48% SB Large Pension Fund/3.17% SB High Yield Index/4.76% Hedge Fund Composite, 1.59%/91-day T-Bill through 12/03; 90.48% LB Aggregate/3.17% SB High Yield Index<br />
/4.76% Hedge Fund Composite/1.59% 91 day T-Bill through 06/04; 87.3% LB Aggregate/ 6.35% Citigroup High Yield Index /4.76% Hedge Fund Composite/1.59% 91-day T-Bill<br />
through 03/05; 87.3% LB Aggregate/ 6.35% Lehman High Yield /4.76% Hedge Fund Composite/1.59% 91-day T-Bill through 03/06; 93.63% LB Aggregate/4.77% Hedge Fund<br />
Composite/1.6% 91-day T-Bill through 9/07; 50% Lehman Long Treasury/ 25% Lehman Intermediate Gov-Credit/ 20% Hedge Fund Composite/ 5% 91 day T-Bill through 9/08; 60%<br />
Lehman Long Treasury/ 15% Lehman Intermediate Gov-Credit/ 20% Hedge Fund Composite/ 5% 91-day T-Bill through 9/09, currently 75% Lehman Long Treasury/ 20% Hedge<br />
Fund Composite/ 5% 91-day T-Bill.<br />
9<br />
Index established 4/2006, NCREIF Property Index (1 quarter lag) + 200 bps through 9/07; 80% Real Estate Composite Index/ 20% US Core CPI + 5% through 9/08; 83% Real<br />
Estate Composite Index/ 17% US Core CPI + 5% through 9/09; currently NCREIF Open Ended Net 1 QTR lagged.<br />
10<br />
Index established 4/2006, NCREIF Property Index (1 quarter lag) + 200 bps through 9/07; 50% LB Global Inflation Linked Bond Index/ 20% Real Estate Composite Index/ 5% US<br />
Core CPI + 5%/ 15% Goldman Sachs Commodity Index/ 10% NAREIT Index through 9/08; 25% BC Global Inflation Linked Bond Index/ 25% BC US TIPS Index/ 25% Real Estate<br />
Composite Index/ 5% US Core CPI + 5%/ 10% Goldman Sachs Commodity Index/ 10% NAREIT Index through 9/09; currently 40% BC Global Inflation Linked Bond Index/ 40%<br />
NCREIF Open Ended Net 1 QTR lagged/ 10% Goldman Sachs Commodity Index/ 10% MSCI US REIT.<br />
84 INVESTMENT SECTION