TRS 2011 Comprehensive Annual Financial Report
TRS 2011 Comprehensive Annual Financial Report
TRS 2011 Comprehensive Annual Financial Report

Create successful ePaper yourself
Turn your PDF publications into a flip-book with our unique Google optimized e-Paper software.
TEACHER RETIREMENT SYSTEM OF TEXAS COMPREHENSIVE ANNUAL FINANCIAL REPORT <strong>2011</strong><br />
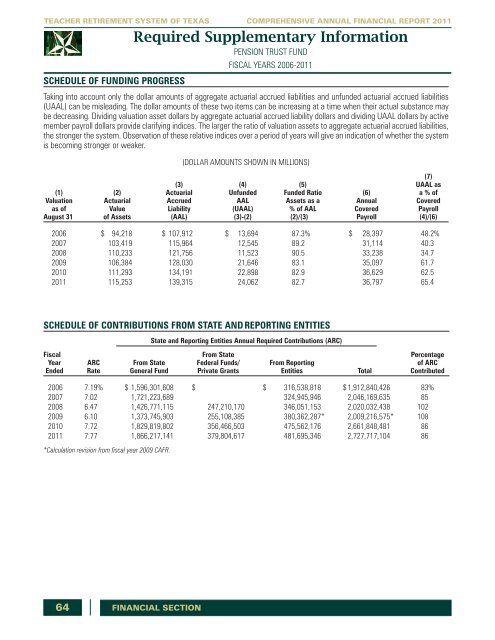
SCHEDULE OF FUNDING PROGRESS<br />
Required Supplementary Information<br />
PENSION TRUST FUND<br />
FISCAL YEARS 2006-<strong>2011</strong><br />
Taking into account only the dollar amounts of aggregate actuarial accrued liabilities and unfunded actuarial accrued liabilities<br />
(UAAL) can be misleading. The dollar amounts of these two items can be increasing at a time when their actual substance may<br />
be decreasing. Dividing valuation asset dollars by aggregate actuarial accrued liability dollars and dividing UAAL dollars by active<br />
member payroll dollars provide clarifying indices. The larger the ratio of valuation assets to aggregate actuarial accrued liabilities,<br />
the stronger the system. Observation of these relative indices over a period of years will give an indication of whether the system<br />
is becoming stronger or weaker.<br />
(DOLLAR AMOUNTS SHOWN IN MILLIONS)<br />
(7)<br />
(3) (4) (5) UAAL as<br />
(1) (2) Actuarial Unfunded Funded Ratio (6) a % of<br />
Valuation Actuarial Accrued AAL Assets as a <strong>Annual</strong> Covered<br />
as of Value Liability (UAAL) % of AAL Covered Payroll<br />
August 31 of Assets (AAL) (3)-(2) (2)/(3) Payroll (4)/(6)<br />
2006 $ 94,218 $ 107,912 $ 13,694 87.3% $ 28,397 48.2%<br />
2007 103,419 115,964 12,545 89.2 31,114 40.3<br />
2008 110,233 121,756 11,523 90.5 33,238 34.7<br />
2009 106,384 128,030 21,646 83.1 35,097 61.7<br />
2010 111,293 134,191 22,898 82.9 36,629 62.5<br />
<strong>2011</strong> 115,253 139,315 24,062 82.7 36,797 65.4<br />
SCHEDULE OF CONTRIBUTIONS FROM STATE AND REPORTING ENTITIES<br />
State and <strong>Report</strong>ing Entities <strong>Annual</strong> Required Contributions (ARC)<br />
Fiscal From State Percentage<br />
Year ARC From State Federal Funds/ From <strong>Report</strong>ing of ARC<br />
Ended Rate General Fund Private Grants Entities Total Contributed<br />
2006 7.19% $ 1,596,301,608 $ $ 316,538,818 $ 1,912,840,426 83%<br />
2007 7.02 1,721,223,689 324,945,946 2,046,169,635 85<br />
2008 6.47 1,426,771,115 247,210,170 346,051,153 2,020,032,438 102<br />
2009 6.10 1,373,745,903 255,108,385 380,362,287* 2,009,216,575* 108<br />
2010 7.72 1,829,819,802 356,466,503 475,562,176 2,661,848,481 86<br />
<strong>2011</strong> 7.77 1,866,217,141 379,804,617 481,695,346 2,727,717,104 86<br />
*Calculation revision from fiscal year 2009 CAFR.<br />
64 FINANCIAL SECTION