TRS 2011 Comprehensive Annual Financial Report
TRS 2011 Comprehensive Annual Financial Report
TRS 2011 Comprehensive Annual Financial Report

You also want an ePaper? Increase the reach of your titles
YUMPU automatically turns print PDFs into web optimized ePapers that Google loves.
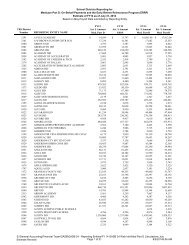
TEACHER RETIREMENT SYSTEM OF TEXAS COMPREHENSIVE ANNUAL FINANCIAL REPORT <strong>2011</strong><br />
<strong>Financial</strong> Trends Information<br />
Benefits and Refund Deductions<br />
from Net Assets by Type<br />
PENSION TRUST FUND<br />
LAST TEN FISCAL YEARS<br />
<strong>2011</strong> 2010 2009 2008<br />
Type of Benefit<br />
Service Retirements ** $ 6,241,946,655 $ 5,841,963,927 $ 5,565,925,090 $ 5,649,308,335*<br />
Deferred Retirement Option 27,822,115 22,607,290 23,272,668 26,757,772<br />
Partial Lump Sum Option 524,925,790 385,555,126 348,261,100 363,668,944<br />
Disability Retirements 144,865,109 141,396,837 138,569,650 146,907,654<br />
Death and Survivor Benefits:<br />
<strong>Annual</strong> Salary 47,295,194 45,698,147 43,235,232 42,216,290<br />
Survivor Annuities 86,898,720 82,574,358 79,951,723 78,862,569<br />
Life Annuities 84,893,007 83,238,898 81,764,240 85,576,098<br />
60 Monthly Payments 11,564,275 10,824,948 10,180,012 10,169,530<br />
Remainder of Contributions 3,293,923 3,537,843 3,274,400 3,177,348<br />
Excess Benefits 1,750,588 1,504,510 1,553,381 1,646,494<br />
TOTAL BENEFITS $ 7,175,255,376 $ 6,618,901,884 $ 6,295,987,496 $ 6,408,291,034<br />
Type of Refund<br />
Death $ 3,984,340 $ 3,710,941 $ 3,084,718 $ 2,520,283<br />
Separation 330,284,482 261,475,648 263,610,358 275,482,331<br />
TOTAL REFUNDS $ 334,268,822 $ 265,186,589 $ 266,695,076 $ 278,002,614<br />
* A one-time supplemental payment capped at $2,400 was distributed to eligible retirees in January 2008.<br />
** For fiscal years 2010 and prior, Service Retirements changed due to the reclassification of Transfers of Service Contributions with Employees Retirement<br />
System of Texas.<br />
Health Care Claims Deductions from Net Assets by Type<br />
<strong>TRS</strong>-CARE (RETIRED PLAN)<br />
LAST TEN FISCAL YEARS<br />
<strong>2011</strong> 2010 2009 2008<br />
Type of Claim<br />
Medical $ 608,461,321 $ 575,539,788 $ 531,239,020 $ 498,767,038<br />
Prescription Drugs 384,017,059 395,817,017 353,893,845 334,742,500<br />
TOTAL $ 992,478,380 $ 971,356,805 $ 885,132,865 $ 833,509,538<br />
Health Care Claims Expenses from Net Assets by Type<br />
<strong>TRS</strong>-ACTIVECARE (ACTIVE PLAN)<br />
LAST NINE FISCAL YEARS (SINCE PLAN INCEPTION)<br />
<strong>2011</strong> 2010 2009 2008<br />
Type of Claim<br />
Medical $ 1,242,673,156 $ 1,092,107,916 $ 934,733,927 $ 788,240,087<br />
Prescription Drugs 267,417,825 221,006,281 187,913,031 163,916,252<br />
TOTAL $ 1,510,090,981 $ 1,313,114,197 $ 1,122,646,958 $ 952,156,339<br />
136 STATISTICAL SECTION