T 7.2.1.3 Amplitude Modulation
T 7.2.1.3 Amplitude Modulation
T 7.2.1.3 Amplitude Modulation

Create successful ePaper yourself
Turn your PDF publications into a flip-book with our unique Google optimized e-Paper software.
TPS <strong>7.2.1.3</strong><br />
Double Sideband AM<br />
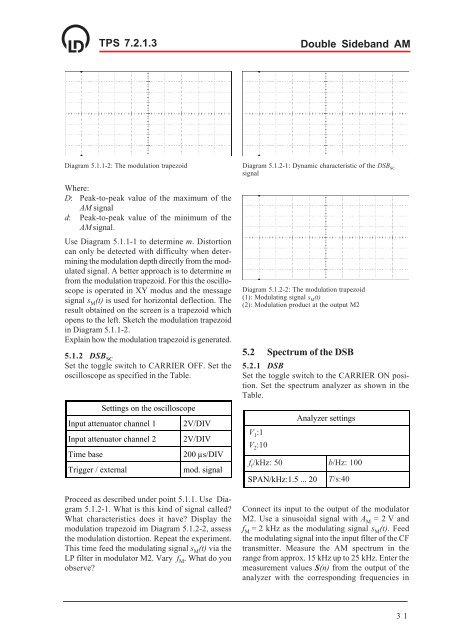
Diagram 5.1.1-2: The modulation trapezoid<br />
Where:<br />
D: Peak-to-peak value of the maximum of the<br />
AM signal<br />
d: Peak-to-peak value of the minimum of the<br />
AM signal.<br />
Use Diagram 5.1.1-1 to determine m. Distortion<br />
can only be detected with difficulty when determining<br />
the modulation depth directly from the modulated<br />
signal. A better approach is to determine m<br />
from the modulation trapezoid. For this the oscilloscope<br />
is operated in XY modus and the message<br />
signal s M (t) is used for horizontal deflection. The<br />
result obtained on the screen is a trapezoid which<br />
opens to the left. Sketch the modulation trapezoid<br />
in Diagram 5.1.1-2.<br />
Explain how the modulation trapezoid is generated.<br />
5.1.2 DSB SC<br />
Set the toggle switch to CARRIER OFF. Set the<br />
oscilloscope as specified in the Table.<br />
Settings on the oscilloscope<br />
Input attenuator channel 1<br />
Input attenuator channel 2<br />
Time base<br />
Trigger / external<br />
2V/DIV<br />
2V/DIV<br />
200 µs/DIV<br />
mod. signal<br />
Proceed as described under point 5.1.1. Use Diagram<br />
5.1.2-1. What is this kind of signal called?<br />
What characteristics does it have? Display the<br />
modulation trapezoid im Diagram 5.1.2-2, assess<br />
the modulation distortion. Repeat the experiment.<br />
This time feed the modulating signal s M (t) via the<br />
LP filter in modulator M2. Vary f M . What do you<br />
observe?<br />
Diagram 5.1.2-1: Dynamic characteristic of the DSB SC<br />
signal<br />
Diagram 5.1.2-2: The modulation trapezoid<br />
(1): Modulating signal s M<br />
(t)<br />
(2): <strong>Modulation</strong> product at the output M2<br />
5.2 Spectrum of the DSB<br />
5.2.1 DSB<br />
Set the toggle switch to the CARRIER ON position.<br />
Set the spectrum analyzer as shown in the<br />
Table.<br />
V 1 :1<br />
V 2 :10<br />
SPAN/kHz:1.5 ... 20<br />
Analyzer settings<br />
f r /kHz: 50 b/Hz: 100<br />
T/s:40<br />
Connect its input to the output of the modulator<br />
M2. Use a sinusoidal signal with A M = 2 V and<br />
f M = 2 kHz as the modulating signal s M (t). Feed<br />
the modulating signal into the input filter of the CF<br />
transmitter. Measure the AM spectrum in the<br />
range from approx. 15 kHz up to 25 kHz. Enter the<br />
measurement values S(n) from the output of the<br />
analyzer with the corresponding frequencies in<br />
31