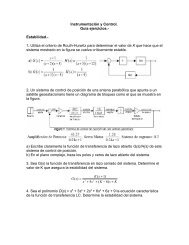
T 7.2.1.3 Amplitude Modulation
T 7.2.1.3 Amplitude Modulation
T 7.2.1.3 Amplitude Modulation

You also want an ePaper? Increase the reach of your titles
YUMPU automatically turns print PDFs into web optimized ePapers that Google loves.
TPS <strong>7.2.1.3</strong><br />
Solutions<br />
5 The Double Sideband AM<br />
Experiment results<br />
5.1 Investigating the dynamic characteristic<br />
of the DSB<br />
5.1.1 DSB<br />
modulation signal. At the same time the amplitude<br />
of the modulated signal drops. Consequently in XY<br />
display modus a trapezoid is produced which the its<br />
broad side on the left.<br />
5.1.2 DSB SC<br />
Diagram 5.1.1-1: Dynamic characteristic of the DSB signal<br />
(1): Modulating signal s M<br />
(t)<br />
(2): <strong>Modulation</strong> product at the output M2<br />
The envelope curve of the AM signal nearly coincides<br />
completely with the modulating signal and<br />
immediately follows its changes in frequency and<br />
amplitude.<br />
Diagram 5.1.2-1: Dynamic characteristic of the DSB SC<br />
signal<br />
(1): Modulating signal s M (t)<br />
(2): <strong>Modulation</strong> product at output M2<br />
The DSB SC signal has the characteristic of a beat,<br />
i.e. it is the linear superpositioning of 2 harmonic<br />
oscillations with very close frequencies. The envelope<br />
curve of the beat shows zero crossings. There<br />
the beat signal experiences phase shifts of 180°.<br />
Also the DSB SC signal follows the frequency<br />
changes of the AF signal without any visible phase<br />
delay. There is no overmodulation caused by<br />
amplitude changes in the modulating signal, as in<br />
the case of DSB.<br />
The modulation trapezoid for DSB SC<br />
.<br />
Diagram 5.1.1-2: The modulation trapezoid<br />
m D − d 65 . − 2<br />
= ≈ ≈ 53%<br />
D+<br />
d 65 . + 2<br />
The modulation index amounts to approx.<br />
m = 53%. Observation: the trapezoid chords are<br />
distorted "cigar-shaped". This is an indication for a<br />
phase shift between the signals at the X and Y<br />
input. These kinds of distortions can scarcely be<br />
seen in Diagrams like 5.1.1-1.<br />
Generating the modulation trapezoid<br />
Oscilloscope set to XY mode. Set the coordinate<br />
origin in the middle of the screen using the X-position<br />
and Y-position controllers. If the modulating<br />
AF signal reaches its negative maximum value,<br />
then the X-deviation is at the far left. From there it<br />
increases horizontally to the right with a rising<br />
Diagram 5.1.2-2: The modulation trapezoid<br />
Observations:<br />
In the display of the modulation trapezoid in XY<br />
mode Lissajous figures appear resembling a double<br />
conic section depending on the modulation frequency<br />
f M . These figures rotate as a function of<br />
the frequency f M . The modulation trapezoid is bet-<br />
53