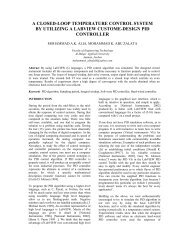
T 7.2.1.3 Amplitude Modulation
T 7.2.1.3 Amplitude Modulation
T 7.2.1.3 Amplitude Modulation

Create successful ePaper yourself
Turn your PDF publications into a flip-book with our unique Google optimized e-Paper software.
%<br />
0<br />
TPS <strong>7.2.1.3</strong><br />
Single Sideband AM<br />
6.2 Spectrum of the SSB<br />
6.2.1 SSB RC<br />
Set the toggle switch to CARRIER ON.<br />
GATE<br />
1s<br />
10s<br />
0,1s<br />
0,01s<br />
TIME A-B<br />
COUNT A<br />
CHECK<br />
FUNCTION<br />
RATIO A/B<br />
PERIOD A<br />
FREQ A<br />
TTL - IN(A) TTL - IN(A)<br />
ANALOG (A)<br />
TTL - IN(B)<br />
Analyzer settings<br />
V 1 :1<br />
V 2 :10<br />
f r /kHz: 50 b/Hz: 100<br />
SPAN/kHz:1.5 ... 20<br />
T/s:40<br />
Set the spectrum analyzer as specified in the Table.<br />
Connect its input to the output of the modulator<br />
M2. As the modulating signal use a sinusoidal<br />
signal with A M = 2 V and f M = 2 kHz. Feed the<br />
modulating signal into the input filter of the CF<br />
transmitter. Measure the SSB spectrum in the<br />
range of approx. 15 kHz up to 25 kHz and enter the<br />
measured values S(n) from the output of the<br />
analyzer with their corresponding frequencies in<br />
Table 6.2.1-1. The amplitude values of the wanted<br />
spectral components are obtained from:<br />
S<br />
AM<br />
S(n)<br />
(n) =<br />
V ⋅ V<br />
1 2<br />
Calculate the spectral components S AM (n) with the<br />
aid of (3-8). Also enter the calculated values for<br />
S AM (n) in Table 6.2.1-1. Plot the curve of the<br />
spectrum in Diagram 6.2.1-1. Label the spectral<br />
lines.<br />
Determine the transmission bandwidth of the AM<br />
signal based on the measurements. Generalize the<br />
results for the case of any modulating signals.<br />
kHz<br />
V pp<br />
=<br />
DC<br />
MODE<br />
FUNCTION<br />
OUT<br />
ATT<br />
dB<br />
20<br />
40<br />
TTL<br />
6.2.2 SSB SC<br />
Set the toggle switch to CARRIER OFF. Use a<br />
sinusoidal signal with A M = 2 V and f M = 2 kHz as<br />
a modulating signal. Measure the spectrum as described<br />
in point 6.2.1. Enter your results in Table<br />
6.2.2-1 and Diagram 6.2.2-1.<br />
Evaluate your measurement results as shown in<br />
point 6.2.1.<br />
I ><br />
I ><br />
U<br />
U<br />
+15V<br />
(+5V)<br />
0V<br />
M1<br />
Fig. 6-4: Experiment setup for SSB<br />
43