T 7.2.1.3 Amplitude Modulation
T 7.2.1.3 Amplitude Modulation
T 7.2.1.3 Amplitude Modulation

Create successful ePaper yourself
Turn your PDF publications into a flip-book with our unique Google optimized e-Paper software.
TPS <strong>7.2.1.3</strong><br />
Double Sideband AM<br />
A C : V V 1 :<br />
f C : kHz b : Hz<br />
f r : kHz<br />
A M : V T : s<br />
f M : kHz<br />
V 2<br />
Table 5.2.3-1: AM spectrum for<br />
square-wave modulation<br />
Signal parameter<br />
f<br />
KHz<br />
Measuerements<br />
Name<br />
S( n)<br />
V<br />
Analyzer settings<br />
S AM (n)<br />
V<br />
Theory<br />
S AM (n)<br />
V<br />
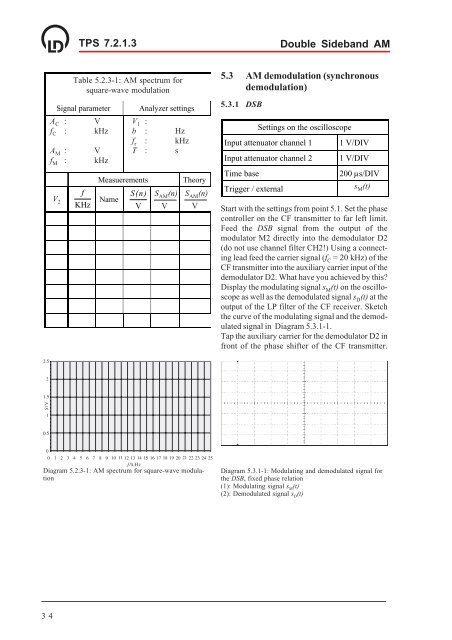
5.3 AM demodulation (synchronous<br />
demodulation)<br />
5.3.1 DSB<br />
Settings on the oscilloscope<br />
Input attenuator channel 1<br />
Input attenuator channel 2<br />
Time base<br />
Trigger / external<br />
1 V/DIV<br />
1 V/DIV<br />
200 µs/DIV<br />
s M (t)<br />
Start with the settings from point 5.1. Set the phase<br />
controller on the CF transmitter to far left limit.<br />
Feed the DSB signal from the output of the<br />
modulator M2 directly into the demodulator D2<br />
(do not use channel filter CH2!) Using a connecting<br />
lead feed the carrier signal (f C = 20 kHz) of the<br />
CF transmitter into the auxiliary carrier input of the<br />
demodulator D2. What have you achieved by this?<br />
Display the modulating signal s M (t) on the oscilloscope<br />
as well as the demodulated signal s D (t) at the<br />
output of the LP filter of the CF receiver. Sketch<br />
the curve of the modulating signal and the demodulated<br />
signal in Diagram 5.3.1-1.<br />
Tap the auxiliary carrier for the demodulator D2 in<br />
front of the phase shifter of the CF transmitter.<br />
Diagram 5.2.3-1: AM spectrum for square-wave modulation<br />
Diagram 5.3.1-1: Modulating and demodulated signal for<br />
the DSB, fixed phase relation<br />
(1): Modulating signal s M (t)<br />
(2): Demodulated signal s D<br />
(t)<br />
34