
Create successful ePaper yourself
Turn your PDF publications into a flip-book with our unique Google optimized e-Paper software.
We also remain committed to investing in manufacturing capacity to match increased demand in our businesses. Our capital<br />
expenditures were primarily focused on expanding manufacturing capacity for LCD glass substrates in the Display Technologies<br />
segment and diesel products in the Environmental Technologies segment. Total capital expenditures for <strong>2007</strong> were $1.3 billion, of<br />
which $883 million was directed toward our Display Technologies segment and $67 million was invested in our Environmental<br />
Technologies segment. In addition, in April <strong>2007</strong>, we announced a $300 million facility improvement plan for the Company’s<br />
Sullivan Park Research and Development campus near <strong>Corning</strong>, New York. The expansion is expected to be completed over a<br />
six-year period.<br />
We expect our 2008 capital spending to be in the range of $1.5 billion to $1.7 billion, of which approximately $800 million to $1.0<br />
billion will be directed toward our Display Technologies segment. In December <strong>2007</strong>, we announced a 5-year capital expenditure plan<br />
of $795 million to locate a glass manufacturing facility at Sharp Corporation’s plant in Sakai City, Japan. Production from this new<br />
facility is expected to meet Sharp Corporation’s plan to begin production of LCD panels for large televisions by March 2010. In<br />
February 2008, we announced a $453 million expansion of our LCD manufacturing facility in Taichung, Taiwan. The range provided<br />
for 2008 for our Display Technologies segment includes some spending for recently announced projects.<br />
RESULTS OF OPERATIONS<br />
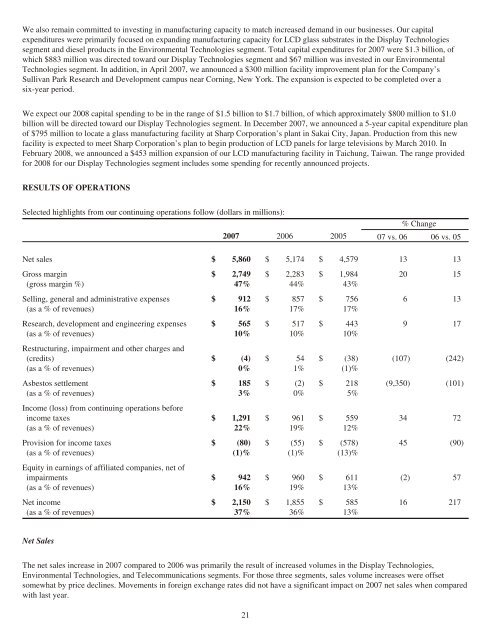
Selected highlights from our continuing operations follow (dollars in millions):<br />
<strong>2007</strong> 2006 2005<br />
% Change<br />
07 vs. 06 06 vs. 05<br />
Net sales $ 5,860 $ 5,174 $ 4,579 13 13<br />
Gross margin $ 2,749 $ 2,283 $ 1,984 20 15<br />
(gross margin %) 47% 44% 43%<br />
Selling, general and administrative expenses $ 912 $ 857 $ 756 6 13<br />
(as a % of revenues) 16% 17% 17%<br />
Research, development and engineering expenses $ 565 $ 517 $ 443 9 17<br />
(as a % of revenues)<br />
Restructuring, impairment and other charges and<br />
10% 10% 10%<br />
(credits) $ (4) $ 54 $ (38) (107) (242)<br />
(as a % of revenues) 0% 1% (1)%<br />
Asbestos settlement $ 185 $ (2) $ 218 (9,350) (101)<br />
(as a % of revenues)<br />
Income (loss) from continuing operations before<br />
3% 0% 5%<br />
income taxes $ 1,291 $ 961 $ 559 34 72<br />
(as a % of revenues) 22% 19% 12%<br />
Provision for income taxes $ (80) $ (55) $ (578) 45 (90)<br />
(as a % of revenues)<br />
Equity in earnings of affiliated companies, net of<br />
(1)% (1)% (13)%<br />
impairments $ 942 $ 960 $ 611 (2) 57<br />
(as a % of revenues) 16% 19% 13%<br />
Net income $ 2,150 $ 1,855 $ 585 16 217<br />
(as a % of revenues) 37% 36% 13%<br />
Net Sales<br />
The net sales increase in <strong>2007</strong> compared to 2006 was primarily the result of increased volumes in the Display Technologies,<br />
Environmental Technologies, and Telecommunications segments. For those three segments, sales volume increases were offset<br />
somewhat by price declines. Movements in foreign exchange rates did not have a significant impact on <strong>2007</strong> net sales when compared<br />
with last year.<br />
21