
Create successful ePaper yourself
Turn your PDF publications into a flip-book with our unique Google optimized e-Paper software.
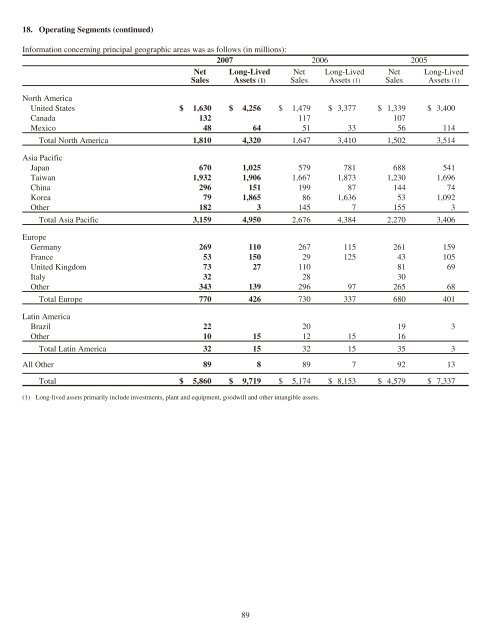
18. Operating Segments (continued)<br />
Information concerning principal geographic areas was as follows (in millions):<br />
<strong>2007</strong> 2006 2005<br />
Net Long-Lived Net Long-Lived Net Long-Lived<br />
Sales Assets (1) Sales Assets (1) Sales Assets (1)<br />
North America<br />
United States $ 1,630 $ 4,256 $ 1,479 $ 3,377 $ 1,339 $ 3,400<br />
Canada 132 117 107<br />
Mexico 48 64 51 33 56 114<br />
Total North America 1,810 4,320 1,647 3,410 1,502 3,514<br />
Asia Pacific<br />
Japan 670 1,025 579 781 688 541<br />
Taiwan 1,932 1,906 1,667 1,873 1,230 1,696<br />
China 296 151 199 87 144 74<br />
Korea 79 1,865 86 1,636 53 1,092<br />
Other 182 3 145 7 155 3<br />
Total Asia Pacific 3,159 4,950 2,676 4,384 2,270 3,406<br />
Europe<br />
Germany 269 110 267 115 261 159<br />
France 53 150 29 125 43 105<br />
United Kingdom 73 27 110 81 69<br />
Italy 32 28 30<br />
Other 343 139 296 97 265 68<br />
Total Europe 770 426 730 337 680 401<br />
Latin America<br />
Brazil 22 20 19 3<br />
Other 10 15 12 15 16<br />
Total Latin America 32 15 32 15 35 3<br />
All Other 89 8 89 7 92 13<br />
Total $ 5,860 $ 9,719 $ 5,174 $ 8,153 $ 4,579 $ 7,337<br />
(1) Long-lived assets primarily include investments, plant and equipment, goodwill and other intangible assets.<br />
89