report
report
report

You also want an ePaper? Increase the reach of your titles
YUMPU automatically turns print PDFs into web optimized ePapers that Google loves.
Granting year<br />
of tranche<br />
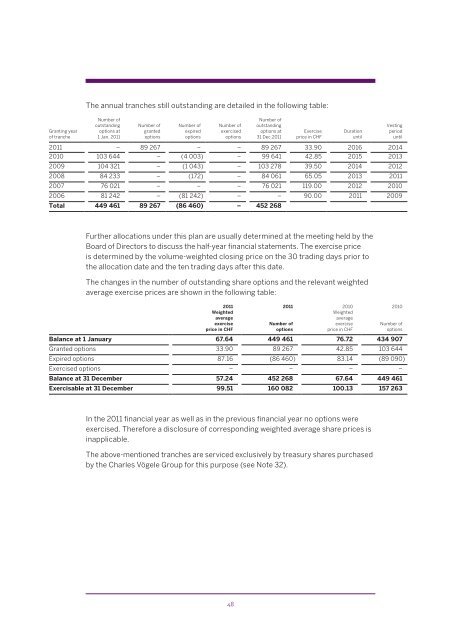
The annual tranches still outstanding are detailed in the following table:<br />
Number of<br />
outstanding<br />
options at<br />
1 Jan. 2011<br />
Number of<br />
granted<br />
options<br />
Number of<br />
expired<br />
options<br />
Number of<br />
exercised<br />
options<br />
48<br />
Number of<br />
outstanding<br />
options at<br />
31 Dec.2011<br />
Exercise<br />
price in CHF<br />
Duration<br />
until<br />
2011 – 89 267 – – 89 267 33.90 2016 2014<br />
2010 103 644 – (4 003) – 99 641 42.85 2015 2013<br />
2009 104 321 – (1 043) – 103 278 39.50 2014 2012<br />
2008 84 233 – (172) – 84 061 65.05 2013 2011<br />
2007 76 021 – – – 76 021 119.00 2012 2010<br />
2006 81 242 – (81 242) – – 90.00 2011 2009<br />
Total 449 461 89 267 (86 460) – 452 268<br />
Further allocations under this plan are usually determined at the meeting held by the<br />
Board of Directors to discuss the half-year financial statements. The exercise price<br />
is determined by the volume-weighted closing price on the 30 trading days prior to<br />
the allocation date and the ten trading days after this date.<br />
The changes in the number of outstanding share options and the relevant weighted<br />
average exercise prices are shown in the following table:<br />
2011<br />
Weighted<br />
average<br />
exercise<br />
price in CHF<br />
2011<br />
Number of<br />
options<br />
2010<br />
Weighted<br />
average<br />
exercise<br />
price in CHF<br />
Vesting<br />
period<br />
until<br />
2010<br />
Number of<br />
options<br />
Balance at 1 January 67.64 449 461 76.72 434 907<br />
Granted options 33.90 89 267 42.85 103 644<br />
Expired options 87.16 (86 460) 83.14 (89 090)<br />
Exercised options – – – –<br />
Balance at 31 December 57.24 452 268 67.64 449 461<br />
Exercisable at 31 December 99.51 160 082 100.13 157 263<br />
In the 2011 financial year as well as in the previous financial year no options were<br />
exercised. Therefore a disclosure of corresponding weighted average share prices is<br />
inapplicable.<br />
The above-mentioned tranches are serviced exclusively by treasury shares purchased<br />
by the Charles Vögele Group for this purpose (see Note 32).