report
report
report

Create successful ePaper yourself
Turn your PDF publications into a flip-book with our unique Google optimized e-Paper software.
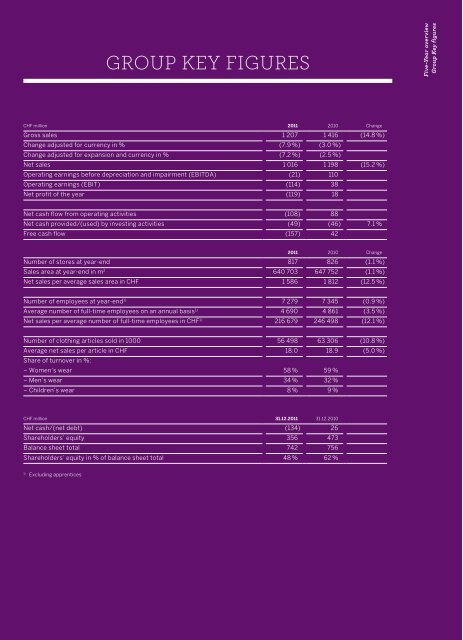
Group KeY FiGures Five-Year overview<br />
CHF million 2011 2010 Change<br />
Gross sales 1 207 1 416 (14.8 %)<br />
Change adjusted for currency in % (7.9 %) (3.0 %)<br />
Change adjusted for expansion and currency in % (7.2 %) (2.5 %)<br />
Net sales 1 016 1 198 (15.2 %)<br />
Operating earnings before depreciation and impairment (EBITDA) (21) 110<br />
Operating earnings (EBIT) (114) 38<br />
Net profit of the year (119) 18<br />
Net cash flow from operating activities (108) 88<br />
Net cash provided/(used) by investing activities (49) (46) 7.1 %<br />
Free cash flow (157) 42<br />
2011 2010 Change<br />
Number of stores at year-end 817 826 (1.1 %)<br />
Sales area at year-end in m2 640 703 647 752 (1.1 %)<br />
Net sales per average sales area in CHF 1 586 1 812 (12.5 %)<br />
Number of employees at year-end 1) 7 279 7 345 (0.9 %)<br />
Average number of full-time employees on an annual basis 1) 4 690 4 861 (3.5 %)<br />
Net sales per average number of full-time employees in CHF1) 216 679 246 498 (12.1 %)<br />
Number of clothing articles sold in 1000 56 498 63 306 (10.8 %)<br />
Average net sales per article in CHF<br />
Share of turnover in %:<br />
18.0 18.9 (5.0 %)<br />
– Women’s wear 58 % 59 %<br />
– Men’s wear 34 % 32 %<br />
– Children’s wear 8 % 9 %<br />
CHF million 31.12.2011 31.12.2010<br />
Net cash/(net debt) (134) 26<br />
Shareholders’ equity 356 473<br />
Balance sheet total 742 756<br />
Shareholders’ equity in % of balance sheet total 48 % 62 %<br />
1) Excluding apprentices<br />
Group Key figures