

Download - FEAS
Download - FEAS
Download - FEAS

You also want an ePaper? Increase the reach of your titles
YUMPU automatically turns print PDFs into web optimized ePapers that Google loves.
FEDERATION OF EURO-ASIAN STOCK EXCHANGES SEMI ANNUAL REPORT APRIL 2007<br />
BAHRAIN STOCK EXCHANGE<br />
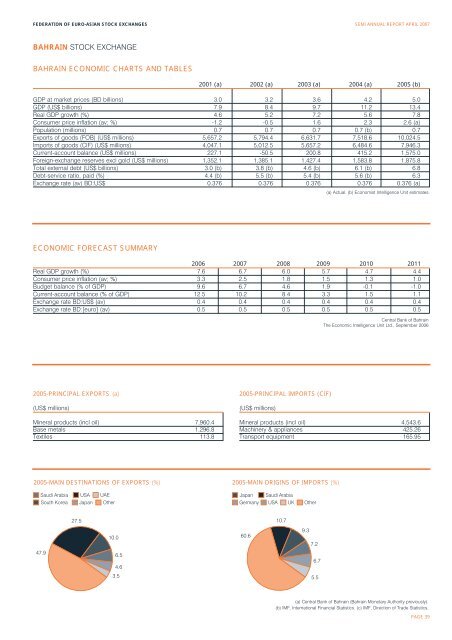
BAHRAIN ECONOMIC CHARTS AND TABLES<br />
2001 (a) 2002 (a) 2003 (a) 2004 (a) 2005 (b)<br />
GDP at market prices (BD billions) 3.0 3.2 3.6 4.2 5.0<br />
GDP (US$ billions) 7.9 8.4 9.7 11.2 13.4<br />
Real GDP growth (%) 4.6 5.2 7.2 5.6 7.8<br />
Consumer price inflation (av; %) -1.2 -0.5 1.6 2.3 2.6 (a)<br />
Population (millions) 0.7 0.7 0.7 0.7 (b) 0.7<br />
Exports of goods (FOB) (US$ millions) 5,657.2 5,794.4 6,631.7 7,518.6 10,024.5<br />
Imports of goods (CIF) (US$ millions) 4,047.1 5,012.5 5,657.2 6,484.6 7,946.3<br />
Current-account balance (US$ millions) 227.1 -50.5 200.8 415.2 1,575.0<br />
Foreign-exchange reserves excl gold (US$ millions) 1,352.1 1,385.1 1,427.4 1,583.8 1,875.8<br />
Total external debt (US$ billions) 3.0 (b) 3.8 (b) 4.6 (b) 6.1 (b) 6.8<br />
Debt-service ratio, paid (%) 4.4 (b) 5.5 (b) 5.4 (b) 5.6 (b) 6.3<br />
Exchange rate (av) BD:US$ 0.376 0.376 0.376 0.376 0.376 (a)<br />
(a) Actual. (b) Economist Intelligence Unit estimates.<br />
ECONOMIC FORECAST SUMMARY<br />
2006 2007 2008 2009 2010 2011<br />
Real GDP growth (%) 7.6 6.7 6.0 5.7 4.7 4.4<br />
Consumer price inflation (av; %) 3.3 2.5 1.8 1.5 1.3 1.0<br />
Budget balance (% of GDP) 9.6 6.7 4.6 1.9 -0.1 -1.0<br />
Current-account balance (% of GDP) 12.5 10.2 8.4 3.3 1.5 1.1<br />
Exchange rate BD:US$ (av) 0.4 0.4 0.4 0.4 0.4 0.4<br />
Exchange rate BD:[euro] (av) 0.5 0.5 0.5 0.5 0.5 0.5<br />
Central Bank of Bahrain<br />
The Economic Intelligence Unit Ltd., September 2006<br />
2005-PRINCIPAL EXPORTS (a)<br />
(US$ millions)<br />
Mineral products (incl oil) 7,960.4<br />
Base metals 1,296.8<br />
Textiles 113.8<br />
2005-PRINCIPAL IMPORTS (CIF)<br />
(US$ millions)<br />
Mineral products (incl oil) 4,543.6<br />
Machinery & appliances 425.26<br />
Transport equipment 165.95<br />
2005-MAIN DESTINATIONS OF EXPORTS (%) 2005-MAIN ORIGINS OF IMPORTS (%)<br />
Saudi Arabia<br />
South Korea<br />
USA<br />
Japan<br />
UAE<br />
Other<br />
Japan<br />
Germany<br />
Saudi Arabia<br />
USA UK<br />
Other<br />
27.5<br />
10.7<br />
10.0<br />
60.6<br />
9.3<br />
7.2<br />
47.9<br />
6.5<br />
4.6<br />
6.7<br />
3.5<br />
5.5<br />
(a) Central Bank of Bahrain (Bahrain Monetary Authority previously).<br />
(b) IMF, International Financial Statistics. (c) IMF, Direction of Trade Statistics.<br />
PAGE 39


