

Download - FEAS
Download - FEAS
Download - FEAS

You also want an ePaper? Increase the reach of your titles
YUMPU automatically turns print PDFs into web optimized ePapers that Google loves.
FEDERATION OF EURO-ASIAN STOCK EXCHANGES SEMI ANNUAL REPORT APRIL 2007<br />
GEORGIAN STOCK EXCHANGE<br />
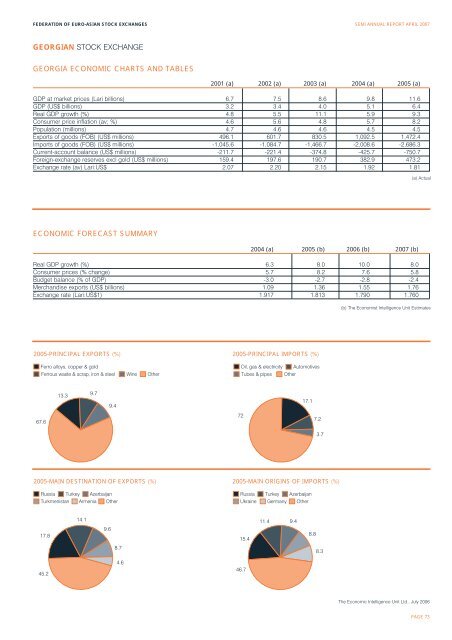
GEORGIA ECONOMIC CHARTS AND TABLES<br />
2001 (a) 2002 (a) 2003 (a) 2004 (a) 2005 (a)<br />
GDP at market prices (Lari billions) 6.7 7.5 8.6 9.8 11.6<br />
GDP (US$ billions) 3.2 3.4 4.0 5.1 6.4<br />
Real GDP growth (%) 4.8 5.5 11.1 5.9 9.3<br />
Consumer price inflation (av; %) 4.6 5.6 4.8 5.7 8.2<br />
Population (millions) 4.7 4.6 4.6 4.5 4.5<br />
Exports of goods (FOB) (US$ millions) 496.1 601.7 830.5 1,092.5 1,472.4<br />
Imports of goods (FOB) (US$ millions) -1,045.6 -1,084.7 -1,466.7 -2,008.6 -2,686.3<br />
Current-account balance (US$ millions) -211.7 -221.4 -374.8 -425.7 -750.7<br />
Foreign-exchange reserves excl gold (US$ millions) 159.4 197.6 190.7 382.9 473.2<br />
Exchange rate (av) Lari:US$ 2.07 2.20 2.15 1.92 1.81<br />
(a) Actual<br />
ECONOMIC FORECAST SUMMARY<br />
2004 (a) 2005 (b) 2006 (b) 2007 (b)<br />
Real GDP growth (%) 6.3 8.0 10.0 8.0<br />
Consumer prices (% change) 5.7 8.2 7.6 5.8<br />
Budget balance (% of GDP) -3.0 -2.7 -2.8 -2.4<br />
Merchandise exports (US$ billions) 1.09 1.36 1.55 1.76<br />
Exchange rate (Lari:US$1) 1.917 1.813 1.790 1.760<br />
(b) The Economist Intelligence Unit Estimates<br />
2005-PRINCIPAL EXPORTS (%) 2005-PRINCIPAL IMPORTS (%)<br />
Ferro alloys, copper & gold<br />
Oil, gas & electricity<br />
Automotives<br />
Ferrous waste & scrap, iron & steel<br />
Wine<br />
Other<br />
Tubes & pipes<br />
Other<br />
13.3<br />
9.7<br />
9.4<br />
17.1<br />
67.6<br />
72<br />
7.2<br />
3.7<br />
2005-MAIN DESTINATION OF EXPORTS (%) 2005-MAIN ORIGINS OF IMPORTS (%)<br />
Russia Turkey Azerbaijan<br />
Turkmenistan Armenia Other<br />
Russia Turkey Azerbaijan<br />
Ukraine Germany Other<br />
14.1<br />
11.4<br />
9.4<br />
17.8<br />
9.6<br />
15.4<br />
8.8<br />
8.7<br />
8.3<br />
4.6<br />
45.2<br />
46.7<br />
The Economic Intelligence Unit Ltd., July 2006<br />
PAGE 73


