

Download - FEAS
Download - FEAS
Download - FEAS

You also want an ePaper? Increase the reach of your titles
YUMPU automatically turns print PDFs into web optimized ePapers that Google loves.
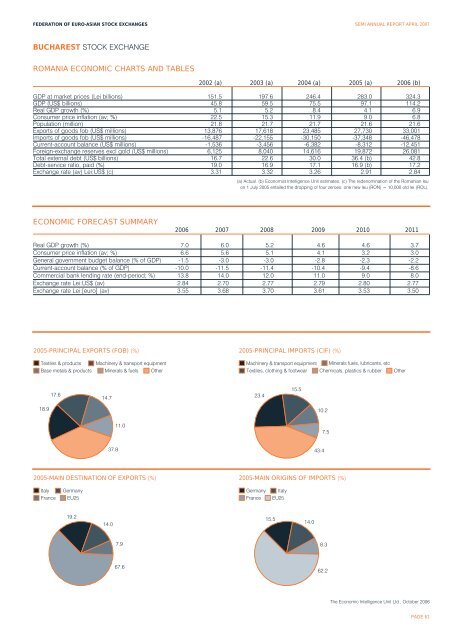
FEDERATION OF EURO-ASIAN STOCK EXCHANGES SEMI ANNUAL REPORT APRIL 2007<br />
BUCHAREST STOCK EXCHANGE<br />
ROMANIA ECONOMIC CHARTS AND TABLES<br />
2002 (a) 2003 (a) 2004 (a) 2005 (a) 2006 (b)<br />
GDP at market prices (Lei billions) 151.5 197.6 246.4 283.0 324.3<br />
GDP (US$ billions) 45.8 59.5 75.5 97.1 114.2<br />
Real GDP growth (%) 5.1 5.2 8.4 4.1 6.9<br />
Consumer price inflation (av; %) 22.5 15.3 11.9 9.0 6.8<br />
Population (million) 21.8 21.7 21.7 21.6 21.6<br />
Exports of goods fob (US$ millions) 13,876 17,618 23,485 27,730 33,001<br />
Imports of goods fob (US$ millions) -16,487 -22,155 -30,150 -37,348 -46,478<br />
Current-account balance (US$ millions) -1,536 -3,456 -6,382 -8,312 -12,451<br />
Foreign-exchange reserves excl gold (US$ millions) 6,125 8,040 14,616 19,872 26,081<br />
Total external debt (US$ billions) 16.7 22.6 30.0 36.4 (b) 42.8<br />
Debt-service ratio, paid (%) 19.0 16.9 17.1 16.9 (b) 17.2<br />
Exchange rate (av) Lei:US$ (c) 3.31 3.32 3.26 2.91 2.84<br />
(a) Actual. (b) Economist Intelligence Unit estimates. (c) The redenomination of the Romanian leu<br />
on 1 July 2005 entailed the dropping of four zeroes: one new leu (RON) = 10,000 old lei (ROL).<br />
ECONOMIC FORECAST SUMMARY<br />
2006 2007 2008 2009 2010 2011<br />
Real GDP growth (%) 7.0 6.0 5.2 4.6 4.6 3.7<br />
Consumer price inflation (av; %) 6.6 5.6 5.1 4.1 3.2 3.0<br />
General government budget balance (% of GDP) -1.5 -3.0 -3.0 -2.8 -2.3 -2.2<br />
Current-account balance (% of GDP) -10.0 -11.5 -11.4 -10.4 -9.4 -8.6<br />
Commercial bank lending rate (end-period; %) 13.8 14.0 12.0 11.0 9.0 8.0<br />
Exchange rate Lei:US$ (av) 2.84 2.70 2.77 2.79 2.80 2.77<br />
Exchange rate Lei:[euro] (av) 3.55 3.68 3.70 3.61 3.53 3.50<br />
2005-PRINCIPAL EXPORTS (FOB) (%) 2005-PRINCIPAL IMPORTS (CIF) (%)<br />
Textiles & products<br />
Machinery & transport equipment<br />
Machinery & transport equipment<br />
Minerals fuels, lubricants, etc<br />
Base metals & products<br />
Minerals & fuels<br />
Other<br />
Textiles, clothing & footwear<br />
Chemicals, plastics & rubber<br />
Other<br />
17.6<br />
14.7<br />
23.4<br />
15.5<br />
18.9<br />
10.2<br />
11.0<br />
7.5<br />
37.8<br />
43.4<br />
2005-MAIN DESTINATION OF EXPORTS (%) 2005-MAIN ORIGINS OF IMPORTS (%)<br />
Italy<br />
Germany<br />
Germany<br />
Italy<br />
France<br />
EU25<br />
France<br />
EU25<br />
19.2<br />
14.0<br />
15.5<br />
14.0<br />
7.9<br />
8.3<br />
67.6<br />
62.2<br />
The Economic Intelligence Unit Ltd., October 2006<br />
PAGE 61


