

Download - FEAS
Download - FEAS
Download - FEAS

You also want an ePaper? Increase the reach of your titles
YUMPU automatically turns print PDFs into web optimized ePapers that Google loves.
FEDERATION OF EURO-ASIAN STOCK EXCHANGES SEMI ANNUAL REPORT APRIL 2007<br />
BANJA LUKA STOCK EXCHANGE<br />
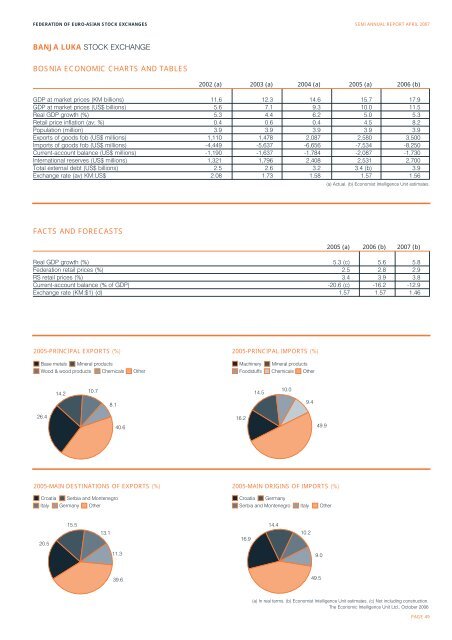
BOSNIA ECONOMIC CHARTS AND TABLES<br />
2002 (a) 2003 (a) 2004 (a) 2005 (a) 2006 (b)<br />
GDP at market prices (KM billions) 11.6 12.3 14.6 15.7 17.9<br />
GDP at market prices (US$ billions) 5.6 7.1 9.3 10.0 11.5<br />
Real GDP growth (%) 5.3 4.4 6.2 5.0 5.3<br />
Retail price inflation (av; %) 0.4 0.6 0.4 4.5 8.2<br />
Population (million) 3.9 3.9 3.9 3.9 3.9<br />
Exports of goods fob (US$ millions) 1,110 1,478 2,087 2,580 3,500<br />
Imports of goods fob (US$ millions) -4,449 -5,637 -6,656 -7,534 -8,250<br />
Current-account balance (US$ millions) -1,190 -1,637 -1,784 -2,087 -1,730<br />
International reserves (US$ millions) 1,321 1,796 2,408 2,531 2,700<br />
Total external debt (US$ billions) 2.5 2.6 3.2 3.4 (b) 3.9<br />
Exchange rate (av) KM:US$ 2.08 1.73 1.58 1.57 1.56<br />
(a) Actual. (b) Economist Intelligence Unit estimates.<br />
FACTS AND FORECASTS<br />
2005 (a) 2006 (b) 2007 (b)<br />
Real GDP growth (%) 5.3 (c) 5.6 5.8<br />
Federation retail prices (%) 2.5 2.8 2.9<br />
RS retail prices (%) 3.4 3.9 3.8<br />
Current-account balance (% of GDP) -20.6 (c) -16.2 -12.9<br />
Exchange rate (KM:$1) (d) 1.57 1.57 1.46<br />
2005-PRINCIPAL EXPORTS (%) 2005-PRINCIPAL IMPORTS (%)<br />
Base metals<br />
Mineral products<br />
Machinery<br />
Mineral products<br />
Wood & wood products<br />
Chemicals<br />
Other<br />
Foodstuffs<br />
Chemicals<br />
Other<br />
14.2<br />
10.7<br />
14.5<br />
10.0<br />
8.1<br />
9.4<br />
26.4<br />
40.6<br />
16.2<br />
49.9<br />
2005-MAIN DESTINATIONS OF EXPORTS (%) 2005-MAIN ORIGINS OF IMPORTS (%)<br />
Croatia<br />
Serbia and Montenegro<br />
Croatia<br />
Germany<br />
Italy<br />
Germany<br />
Other<br />
Serbia and Montenegro<br />
Italy<br />
Other<br />
15.5<br />
14.4<br />
20.5<br />
13.1<br />
16.9<br />
10.2<br />
11.3<br />
9.0<br />
39.6<br />
49.5<br />
(a) In real terms. (b) Economist Intelligence Unit estimates. (c) Not including construction.<br />
The Economic Intelligence Unit Ltd., October 2006<br />
PAGE 49


