

Download - FEAS
Download - FEAS
Download - FEAS

You also want an ePaper? Increase the reach of your titles
YUMPU automatically turns print PDFs into web optimized ePapers that Google loves.
FEDERATION OF EURO-ASIAN STOCK EXCHANGES SEMI ANNUAL REPORT APRIL 2007<br />
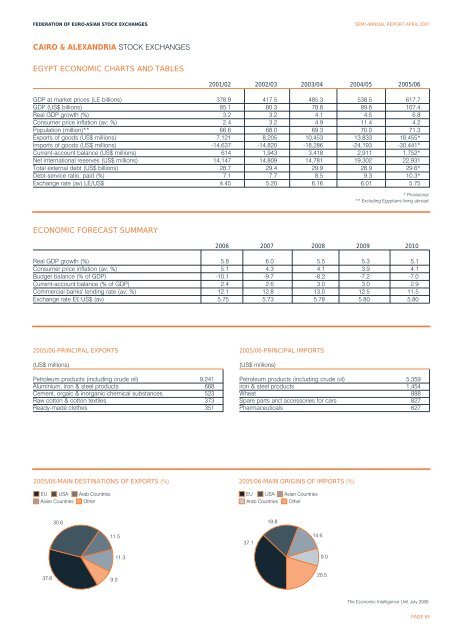
CAIRO & ALEXANDRIA STOCK EXCHANGES<br />
EGYPT ECONOMIC CHARTS AND TABLES<br />
2001/02 2002/03 2003/04 2004/05 2005/06<br />
GDP at market prices (LE billions) 378.9 417.5 485.3 538.5 617.7<br />
GDP (US$ billions) 85.1 80.3 78.8 89.6 107.4<br />
Real GDP growth (%) 3.2 3.2 4.1 4.5 6.8<br />
Consumer price inflation (av; %) 2.4 3.2 4.9 11.4 4.2<br />
Population (million)** 66.6 68.0 69.3 70.0 71.3<br />
Exports of goods (US$ millions) 7,121 8,205 10,453 13,833 18,455*<br />
Imports of goods (US$ millions) -14,637 -14,820 -18,286 -24,193 -30,441*<br />
Current-account balance (US$ millions) 614 1,943 3,418 2,911 1,752*<br />
Net international reserves (US$ millions) 14,147 14,809 14,781 19,302 22,931<br />
Total external debt (US$ billions) 28.7 29.4 29.9 28.9 29.6*<br />
Debt-service ratio, paid (%) 7.1 7.7 8.5 9.3 10.3*<br />
Exchange rate (av) LE/US$ 4.45 5.20 6.16 6.01 5.75<br />
* Provisional<br />
** Excluding Egyptians living abroad<br />
ECONOMIC FORECAST SUMMARY<br />
2006 2007 2008 2009 2010<br />
Real GDP growth (%) 5.8 6.0 5.5 5.3 5.1<br />
Consumer price inflation (av; %) 5.1 4.3 4.1 3.9 4.1<br />
Budget balance (% of GDP) -10.1 -9.7 -8.2 -7.2 -7.0<br />
Current-account balance (% of GDP) 2.4 2.6 3.0 3.0 2.9<br />
Commercial banks' lending rate (av; %) 12.1 12.8 13.0 12.5 11.5<br />
Exchange rate E£:US$ (av) 5.75 5.73 5.78 5.80 5.80<br />
2005/06-PRINCIPAL EXPORTS<br />
(US$ millions)<br />
Petroleum products (including crude oil) 9,241<br />
Aluminium, iron & steel products 668<br />
Cement, orgaic & inorganic chemical substances 523<br />
Raw cotton & cotton textiles 373<br />
Ready-made clothes 351<br />
2005/06-PRINCIPAL IMPORTS<br />
(US$ millions)<br />
Petroleum products (including crude oil) 5,359<br />
iron & steel products 1,454<br />
Wheat 888<br />
Spare parts and accessories for cars 827<br />
Pharmaceuticals 627<br />
2005/06-MAIN DESTINATIONS OF EXPORTS (%) 2005/06-MAIN ORIGINS OF IMPORTS (%)<br />
EU<br />
USA<br />
Arab Countries<br />
EU<br />
USA<br />
Asian Countries<br />
Asian Countries<br />
Other<br />
Arab Countries<br />
Other<br />
30.6<br />
18.8<br />
11.5<br />
37.1<br />
14.6<br />
11.3<br />
9.0<br />
37.6<br />
9.0<br />
20.5<br />
The Economic Intelligence Unit July 2006<br />
PAGE 69


