Vol 44 # 2 June 2012 - Kma.org.kw
Vol 44 # 2 June 2012 - Kma.org.kw
Vol 44 # 2 June 2012 - Kma.org.kw

You also want an ePaper? Increase the reach of your titles
YUMPU automatically turns print PDFs into web optimized ePapers that Google loves.
<strong>June</strong> <strong>2012</strong><br />
KUWAIT MEDICAL JOURNAL 108<br />
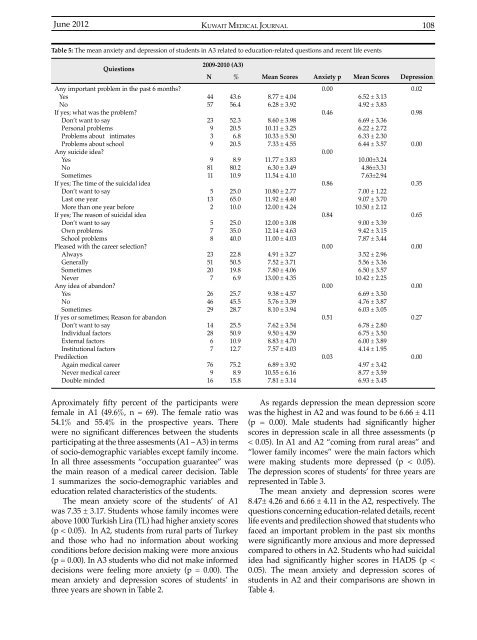
Table 5: The mean anxiety and depression of students in A3 related to education-related questions and recent life events<br />
Quiestions<br />
Any important problem in the past 6 months?<br />
Yes<br />
No<br />
If yes; what was the problem?<br />
Don’t want to say<br />
Personal problems<br />
Problems about intimates<br />
Problems about school<br />
Any suicide idea?<br />
Yes<br />
No<br />
Sometimes<br />
If yes; The time of the suicidal idea<br />
Don’t want to say<br />
Last one year<br />
More than one year before<br />
If yes; The reason of suicidal idea<br />
Don’t want to say<br />
Own problems<br />
School problems<br />
Pleased with the career selection?<br />
Always<br />
Generally<br />
Sometimes<br />
Never<br />
Any idea of abandon?<br />
Yes<br />
No<br />
Sometimes<br />
If yes or sometimes; Reason for abandon<br />
Don’t want to say<br />
Individual factors<br />
External factors<br />
Institutional factors<br />
Predilection<br />
Again medical career<br />
Never medical career<br />
Double minded<br />
2009-2010 (A3)<br />
N % Mean Scores Anxiety p Mean Scores Depression<br />
0.00<br />
0.02<br />
<strong>44</strong> 43.6 8.77 ± 4.04<br />
6.52 ± 3.13<br />
57 56.4 6.28 ± 3.92<br />
4.92 ± 3.83<br />
23<br />
9<br />
3<br />
9<br />
9<br />
81<br />
11<br />
5<br />
13<br />
2<br />
5<br />
7<br />
8<br />
23<br />
51<br />
20<br />
7<br />
26<br />
46<br />
29<br />
14<br />
28<br />
6<br />
7<br />
76<br />
9<br />
16<br />
52.3<br />
20.5<br />
6.8<br />
20.5<br />
8.9<br />
80.2<br />
10.9<br />
25.0<br />
65.0<br />
10.0<br />
25.0<br />
35.0<br />
40.0<br />
22.8<br />
50.5<br />
19.8<br />
6.9<br />
25.7<br />
45.5<br />
28.7<br />
25.5<br />
50.9<br />
10.9<br />
12.7<br />
75.2<br />
8.9<br />
15.8<br />
8.60 ± 3.98<br />
10.11 ± 3.25<br />
10.33 ± 5.50<br />
7.33 ± 4.55<br />
11.77 ± 3.83<br />
6.30 ± 3.49<br />
11.54 ± 4.10<br />
10.80 ± 2.77<br />
11.92 ± 4.40<br />
12.00 ± 4.24<br />
12.00 ± 3.08<br />
12.14 ± 4.63<br />
11.00 ± 4.03<br />
4.91 ± 3.27<br />
7.52 ± 3.71<br />
7.80 ± 4.06<br />
13.00 ± 4.35<br />
9.38 ± 4.57<br />
5.76 ± 3.39<br />
8.10 ± 3.94<br />
7.62 ± 3.54<br />
9.50 ± 4.59<br />
8.83 ± 4.70<br />
7.57 ± 4.03<br />
6.89 ± 3.92<br />
10.55 ± 6.16<br />
7.81 ± 3.14<br />
0.46<br />
0.00<br />
0.86<br />
0.84<br />
0.00<br />
0.00<br />
0.51<br />
0.03<br />
6.69 ± 3.36<br />
6.22 ± 2.72<br />
6.33 ± 2.30<br />
6.<strong>44</strong> ± 3.57<br />
10.00±3.24<br />
4.86±3.31<br />
7.63±2.94<br />
7.00 ± 1.22<br />
9.07 ± 3.70<br />
10.50 ± 2.12<br />
9.00 ± 3.39<br />
9.42 ± 3.15<br />
7.87 ± 3.<strong>44</strong><br />
3.52 ± 2.96<br />
5.56 ± 3.36<br />
6.50 ± 3.57<br />
10.42 ± 2.25<br />
6.69 ± 3.50<br />
4.76 ± 3.87<br />
6.03 ± 3.05<br />
6.78 ± 2.80<br />
6.75 ± 3.50<br />
6.00 ± 3.89<br />
4.14 ± 1.95<br />
4.97 ± 3.42<br />
8.77 ± 3.59<br />
6.93 ± 3.45<br />
0.98<br />
0.00<br />
0.35<br />
0.65<br />
0.00<br />
0.00<br />
0.27<br />
0.00<br />
Aproximately fifty percent of the participants were<br />
female in A1 (49.6%, n = 69). The female ratio was<br />
54.1% and 55.4% in the prospective years. There<br />
were no significant differences between the students<br />
participating at the three assesments (A1 – A3) in terms<br />
of socio-demographic variables except family income.<br />
In all three assessments “occupation guarantee” was<br />
the main reason of a medical career decision. Table<br />
1 summarizes the socio-demographic variables and<br />
education related characteristics of the students.<br />
The mean anxiety score of the students’ of A1<br />
was 7.35 ± 3.17. Students whose family incomes were<br />
above 1000 Turkish Lira (TL) had higher anxiety scores<br />
(p < 0.05). In A2, students from rural parts of Turkey<br />
and those who had no information about working<br />
conditions before decision making were more anxious<br />
(p = 0.00). In A3 students who did not make informed<br />
decisions were feeling more anxiety (p = 0.00). The<br />
mean anxiety and depression scores of students’ in<br />
three years are shown in Table 2.<br />
As regards depression the mean depression score<br />
was the highest in A2 and was found to be 6.66 ± 4.11<br />
(p = 0.00). Male students had significantly higher<br />
scores in depression scale in all three assessments (p<br />
< 0.05). In A1 and A2 “coming from rural areas” and<br />
“lower family incomes” were the main factors which<br />
were making students more depressed (p < 0.05).<br />
The depression scores of students’ for three years are<br />
represented in Table 3.<br />
The mean anxiety and depression scores were<br />
8.47± 4.26 and 6.66 ± 4.11 in the A2, respectively. The<br />
questions concerning education-related details, recent<br />
life events and predilection showed that students who<br />
faced an important problem in the past six months<br />
were significantly more anxious and more depressed<br />
compared to others in A2. Students who had suicidal<br />
idea had significantly higher scores in HADS (p <<br />
0.05). The mean anxiety and depression scores of<br />
students in A2 and their comparisons are shown in<br />
Table 4.