Vol 44 # 2 June 2012 - Kma.org.kw
Vol 44 # 2 June 2012 - Kma.org.kw
Vol 44 # 2 June 2012 - Kma.org.kw

You also want an ePaper? Increase the reach of your titles
YUMPU automatically turns print PDFs into web optimized ePapers that Google loves.
<strong>June</strong> <strong>2012</strong><br />
KUWAIT MEDICAL JOURNAL 128<br />
serum ferritin, serum iron, total iron binding capacity,<br />
and hemogram values in blood samples obtained<br />
during the EF and LL phases. Plasma glucose, serum<br />
total iron binding capacity (TIBC) and iron (Fe) was<br />
analyzed using the enzymatic kinetic (hexokinase-<br />
UV/NAD) method on an Olympus AU400 instrument<br />
with Olympus agents. Intra-assay and interassay<br />
Co-efficient Variation (CV) percent respectively<br />
was for glucose < 3.5%, Fe < 4%, TIBC < 2%. Serum<br />
ferritin level was measured by Beckman Coullter<br />
(< 10% CV). Hemogram values were analyzed on<br />
MH6000 (Medpa) (for Plt CV < 6 for others < 5%).<br />
Body Mass Index (BMI) was defined as the body<br />
weight (kilograms) divided by height (meters) 2 .<br />
The categorization of the patients relative to the BMI<br />
was carried out according to the classification of the<br />
World Health Organization (≤ 18.5, underweight; 18.5<br />
- 24.9, normal; 25 - 29.9, overweight; and 30 - 34.9,<br />
Class I obesity) [20] . The individuals with an additional<br />
disease (e.g., anemia, ovarian cyst, thyroid disease,<br />
etc) were excluded from the study.<br />
Statistical Analysis<br />
The statistical analysis was made with SPSS<br />
(Statistical Package for Social Sciences 15.0 version).<br />
The data were analyzed by using number and<br />
percentage distributions, descriptive statistics (mean,<br />
frequency, standard deviation) as well as ANOVA,<br />
Tukey, Kruskal-Wallis, Mann-Whitney U tests and<br />
Paired t-test.<br />
RESULTS<br />
In this study, the mean age of the subjects was 20.21<br />
± 2.76 years. The subjects were categorized based on the<br />
BMI value as follows: 21.2% were underweight, 69.5%<br />
were normal, 7.6% were overweight, and 1.7% were<br />
Class I obese. While 57.6% of the study population<br />
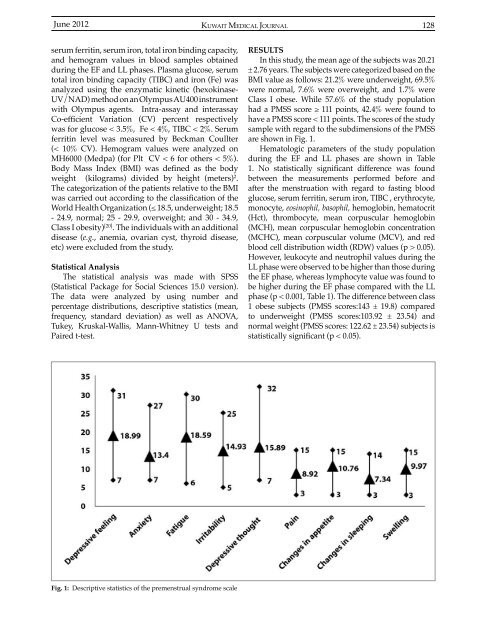
had a PMSS score ≥ 111 points, 42.4% were found to<br />
have a PMSS score < 111 points. The scores of the study<br />
sample with regard to the subdimensions of the PMSS<br />
are shown in Fig. 1.<br />
Hematologic parameters of the study population<br />
during the EF and LL phases are shown in Table<br />
1. No statistically significant difference was found<br />
between the measurements performed before and<br />
after the menstruation with regard to fasting blood<br />
glucose, serum ferritin, serum iron, TIBC , erythrocyte,<br />
monocyte, eosinophil, basophil, hemoglobin, hematocrit<br />
(Hct), thrombocyte, mean corpuscular hemoglobin<br />
(MCH), mean corpuscular hemoglobin concentration<br />
(MCHC), mean corpuscular volume (MCV), and red<br />
blood cell distribution width (RDW) values (p > 0.05).<br />
However, leukocyte and neutrophil values during the<br />
LL phase were observed to be higher than those during<br />
the EF phase, whereas lymphocyte value was found to<br />
be higher during the EF phase compared with the LL<br />
phase (p < 0.001, Table 1). The difference between class<br />
1 obese subjects (PMSS scores:143 ± 19.8) compared<br />
to underweight (PMSS scores:103.92 ± 23.54) and<br />
normal weight (PMSS scores: 122.62 ± 23.54) subjects is<br />
statistically significant (p < 0.05).<br />
Fig. 1: Descriptive statistics of the premenstrual syndrome scale