Daly City's Green Vision - City of Daly City
Daly City's Green Vision - City of Daly City
Daly City's Green Vision - City of Daly City

You also want an ePaper? Increase the reach of your titles
YUMPU automatically turns print PDFs into web optimized ePapers that Google loves.
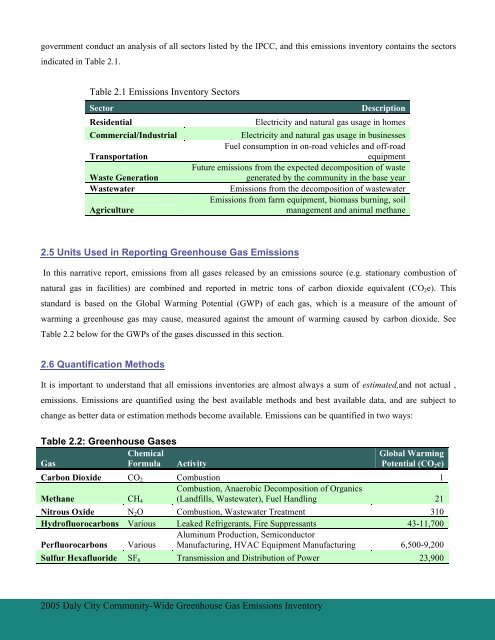
government conduct an analysis <strong>of</strong> all sectors listed by the IPCC, and this emissions inventory contains the sectors<br />
indicated in Table 2.1.<br />
Table 2.1 Emissions Inventory Sectors<br />
Sector<br />
Residential<br />
Commercial/Industrial<br />
Transportation<br />
Waste Generation<br />
Wastewater<br />
Agriculture<br />
Description<br />
Electricity and natural gas usage in homes<br />
Electricity and natural gas usage in businesses<br />
Fuel consumption in on-road vehicles and <strong>of</strong>f-road<br />
equipment<br />
Future emissions from the expected decomposition <strong>of</strong> waste<br />
generated by the community in the base year<br />
Emissions from the decomposition <strong>of</strong> wastewater<br />
Emissions from farm equipment, biomass burning, soil<br />
management and animal methane<br />
2.5 Units Used in Reporting <strong>Green</strong>house Gas Emissions<br />
In this narrative report, emissions from all gases released by an emissions source (e.g. stationary combustion <strong>of</strong><br />
natural gas in facilities) are combined and reported in metric tons <strong>of</strong> carbon dioxide equivalent (CO 2 e). This<br />
standard is based on the Global Warming Potential (GWP) <strong>of</strong> each gas, which is a measure <strong>of</strong> the amount <strong>of</strong><br />
warming a greenhouse gas may cause, measured against the amount <strong>of</strong> warming caused by carbon dioxide. See<br />
Table 2.2 below for the GWPs <strong>of</strong> the gases discussed in this section.<br />
2.6 Quantification Methods<br />
It is important to understand that all emissions inventories are almost always a sum <strong>of</strong> estimated,and not actual ,<br />
emissions. Emissions are quantified using the best available methods and best available data, and are subject to<br />
change as better data or estimation methods become available. Emissions can be quantified in two ways:<br />
Table 2.2: <strong>Green</strong>house Gases<br />
Gas<br />
Chemical<br />
Formula Activity<br />
Global Warming<br />
Potential (CO 2 e)<br />
Carbon Dioxide CO 2 Combustion 1<br />
Methane CH 4<br />
Combustion, Anaerobic Decomposition <strong>of</strong> Organics<br />
(Landfills, Wastewater), Fuel Handling 21<br />
Nitrous Oxide N 2 O Combustion, Wastewater Treatment 310<br />
Hydr<strong>of</strong>luorocarbons Various Leaked Refrigerants, Fire Suppressants 43-11,700<br />
Aluminum Production, Semiconductor<br />
Perfluorocarbons Various Manufacturing, HVAC Equipment Manufacturing 6,500-9,200<br />
Sulfur Hexafluoride SF 6 Transmission and Distribution <strong>of</strong> Power 23,900<br />
2005 <strong>Daly</strong> <strong>City</strong> Community-Wide <strong>Green</strong>house Gas Emissions Inventory