Daly City's Green Vision - City of Daly City
Daly City's Green Vision - City of Daly City
Daly City's Green Vision - City of Daly City

You also want an ePaper? Increase the reach of your titles
YUMPU automatically turns print PDFs into web optimized ePapers that Google loves.
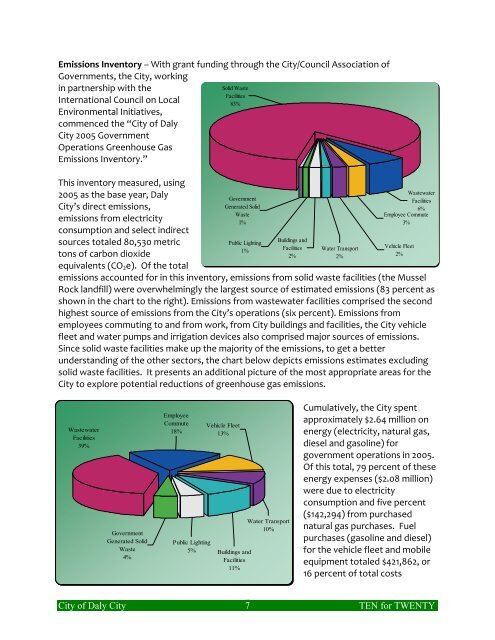
Emissions Inventory – With grant funding through the <strong>City</strong>/Council Association <strong>of</strong><br />
Governments, the <strong>City</strong>, working<br />
in partnership with the<br />
International Council on Local<br />
Environmental Initiatives,<br />
commenced the “<strong>City</strong> <strong>of</strong> <strong>Daly</strong><br />
<strong>City</strong> 2005 Government<br />
Operations <strong>Green</strong>house Gas<br />
Emissions Inventory.”<br />
This inventory measured, using<br />
2005 as the base year, <strong>Daly</strong><br />
<strong>City</strong>’s direct emissions,<br />
emissions from electricity<br />
consumption and select indirect<br />
sources totaled 80,530 metric<br />
tons <strong>of</strong> carbon dioxide<br />
equivalents (CO 2 e). Of the total<br />
Solid Waste<br />
Facilities<br />
83%<br />
Government<br />
Generated Solid<br />
Waste<br />
1%<br />
Public Lighting<br />
1%<br />
Buildings and<br />
Facilities<br />
2%<br />
Water Transport<br />
2%<br />
Wastewater<br />
Facilities<br />
6%<br />
Employee Commute<br />
3%<br />
Vehicle Fleet<br />
2%<br />
emissions accounted for in this inventory, emissions from solid waste facilities (the Mussel<br />
Rock landfill) were overwhelmingly the largest source <strong>of</strong> estimated emissions (83 percent as<br />
shown in the chart to the right). Emissions from wastewater facilities comprised the second<br />
highest source <strong>of</strong> emissions from the <strong>City</strong>’s operations (six percent). Emissions from<br />
employees commuting to and from work, from <strong>City</strong> buildings and facilities, the <strong>City</strong> vehicle<br />
fleet and water pumps and irrigation devices also comprised major sources <strong>of</strong> emissions.<br />
Since solid waste facilities make up the majority <strong>of</strong> the emissions, to get a better<br />
understanding <strong>of</strong> the other sectors, the chart below depicts emissions estimates excluding<br />
solid waste facilities. It presents an additional picture <strong>of</strong> the most appropriate areas for the<br />
<strong>City</strong> to explore potential reductions <strong>of</strong> greenhouse gas emissions.<br />
Wastewater<br />
Facilities<br />
39%<br />
Government<br />
Generated Solid<br />
Waste<br />
4%<br />
Employee<br />
Commute<br />
18%<br />
Public Lighting<br />
5%<br />
Vehicle Fleet<br />
13%<br />
Buildings and<br />
Facilities<br />
11%<br />
Water Transport<br />
10%<br />
Cumulatively, the <strong>City</strong> spent<br />
approximately $2.64 million on<br />
energy (electricity, natural gas,<br />
diesel and gasoline) for<br />
government operations in 2005.<br />
Of this total, 79 percent <strong>of</strong> these<br />
energy expenses ($2.08 million)<br />
were due to electricity<br />
consumption and five percent<br />
($142,294) from purchased<br />
natural gas purchases. Fuel<br />
purchases (gasoline and diesel)<br />
for the vehicle fleet and mobile<br />
equipment totaled $421,862, or<br />
16 percent <strong>of</strong> total costs<br />
<strong>City</strong> <strong>of</strong> <strong>Daly</strong> <strong>City</strong><br />
7<br />
TEN for TWENTY