Daly City's Green Vision - City of Daly City
Daly City's Green Vision - City of Daly City
Daly City's Green Vision - City of Daly City

Create successful ePaper yourself
Turn your PDF publications into a flip-book with our unique Google optimized e-Paper software.
Sector<br />
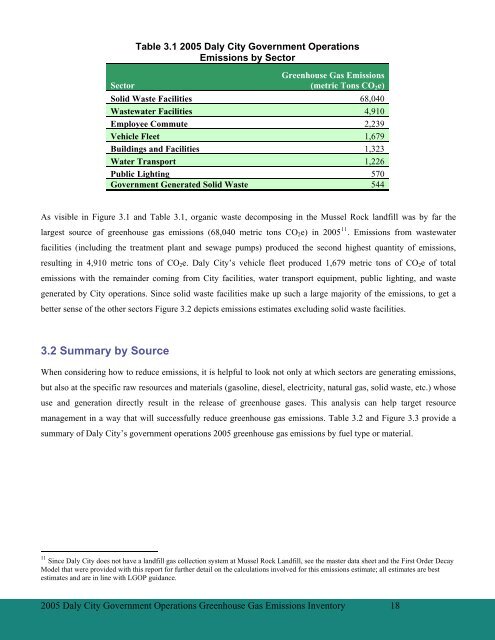
Table 3.1 2005 <strong>Daly</strong> <strong>City</strong> Government Operations<br />
Emissions by Sector<br />
<strong>Green</strong>house Gas Emissions<br />
(metric Tons CO 2 e)<br />
Solid Waste Facilities 68,040<br />
Wastewater Facilities 4,910<br />
Employee Commute 2,239<br />
Vehicle Fleet 1,679<br />
Buildings and Facilities 1,323<br />
Water Transport 1,226<br />
Public Lighting 570<br />
Government Generated Solid Waste 544<br />
As visible in Figure 3.1 and Table 3.1, organic waste decomposing in the Mussel Rock landfill was by far the<br />
largest source <strong>of</strong> greenhouse gas emissions (68,040 metric tons CO 2 e) in 2005 11 . Emissions from wastewater<br />
facilities (including the treatment plant and sewage pumps) produced the second highest quantity <strong>of</strong> emissions,<br />
resulting in 4,910 metric tons <strong>of</strong> CO 2 e. <strong>Daly</strong> <strong>City</strong>’s vehicle fleet produced 1,679 metric tons <strong>of</strong> CO 2 e <strong>of</strong> total<br />
emissions with the remainder coming from <strong>City</strong> facilities, water transport equipment, public lighting, and waste<br />
generated by <strong>City</strong> operations. Since solid waste facilities make up such a large majority <strong>of</strong> the emissions, to get a<br />
better sense <strong>of</strong> the other sectors Figure 3.2 depicts emissions estimates excluding solid waste facilities.<br />
3.2 Summary by Source<br />
When considering how to reduce emissions, it is helpful to look not only at which sectors are generating emissions,<br />
but also at the specific raw resources and materials (gasoline, diesel, electricity, natural gas, solid waste, etc.) whose<br />
use and generation directly result in the release <strong>of</strong> greenhouse gases. This analysis can help target resource<br />
management in a way that will successfully reduce greenhouse gas emissions. Table 3.2 and Figure 3.3 provide a<br />
summary <strong>of</strong> <strong>Daly</strong> <strong>City</strong>’s government operations 2005 greenhouse gas emissions by fuel type or material.<br />
11 Since <strong>Daly</strong> <strong>City</strong> does not have a landfill gas collection system at Mussel Rock Landfill, see the master data sheet and the First Order Decay<br />
Model that were provided with this report for further detail on the calculations involved for this emissions estimate; all estimates are best<br />
estimates and are in line with LGOP guidance.<br />
2005 <strong>Daly</strong> <strong>City</strong> Government Operations <strong>Green</strong>house Gas Emissions Inventory 18