Daly City's Green Vision - City of Daly City
Daly City's Green Vision - City of Daly City
Daly City's Green Vision - City of Daly City

Create successful ePaper yourself
Turn your PDF publications into a flip-book with our unique Google optimized e-Paper software.
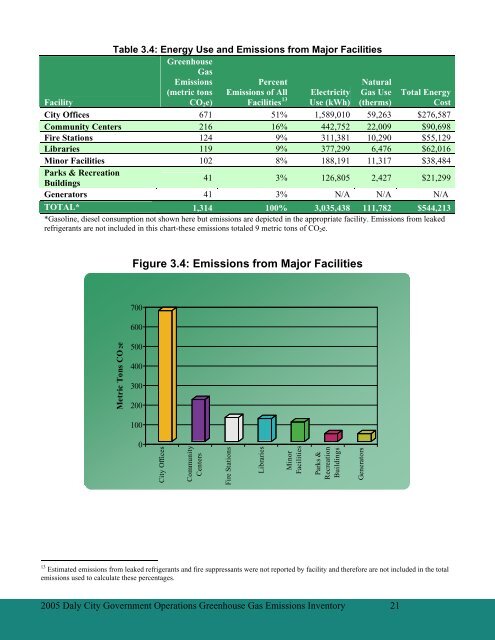
Table 3.4: Energy Use and Emissions from Major Facilities<br />
<strong>Green</strong>house<br />
Gas<br />
Emissions<br />
Percent<br />
Natural<br />
(metric tons Emissions <strong>of</strong> All Electricity Gas Use<br />
CO 2 e) Facilities 13 Use (kWh) (therms)<br />
Total Energy<br />
Cost<br />
Facility<br />
<strong>City</strong> Offices 671 51% 1,589,010 59,263 $276,587<br />
Community Centers 216 16% 442,752 22,009 $90,698<br />
Fire Stations 124 9% 311,381 10,290 $55,129<br />
Libraries 119 9% 377,299 6,476 $62,016<br />
Minor Facilities 102 8% 188,191 11,317 $38,484<br />
Parks & Recreation<br />
41 3% 126,805 2,427 $21,299<br />
Buildings<br />
Generators 41 3% N/A N/A N/A<br />
TOTAL* 1,314 100% 3,035,438 111,782 $544,213<br />
*Gasoline, diesel consumption not shown here but emissions are depicted in the appropriate facility. Emissions from leaked<br />
refrigerants are not included in this chart-these emissions totaled 9 metric tons <strong>of</strong> CO 2 e.<br />
Figure 3.4: Emissions from Major Facilities<br />
700<br />
600<br />
Metric Tons CO 2e<br />
500<br />
400<br />
300<br />
200<br />
100<br />
0<br />
<strong>City</strong> Offices<br />
Community<br />
Centers<br />
Fire Stations<br />
Libraries<br />
Minor<br />
Facilities<br />
Parks &<br />
Recreation<br />
Buildings<br />
Generators<br />
13 Estimated emissions from leaked refrigerants and fire suppressants were not reported by facility and therefore are not included in the total<br />
emissions used to calculate these percentages.<br />
2005 <strong>Daly</strong> <strong>City</strong> Government Operations <strong>Green</strong>house Gas Emissions Inventory 21