Daly City's Green Vision - City of Daly City
Daly City's Green Vision - City of Daly City
Daly City's Green Vision - City of Daly City

You also want an ePaper? Increase the reach of your titles
YUMPU automatically turns print PDFs into web optimized ePapers that Google loves.
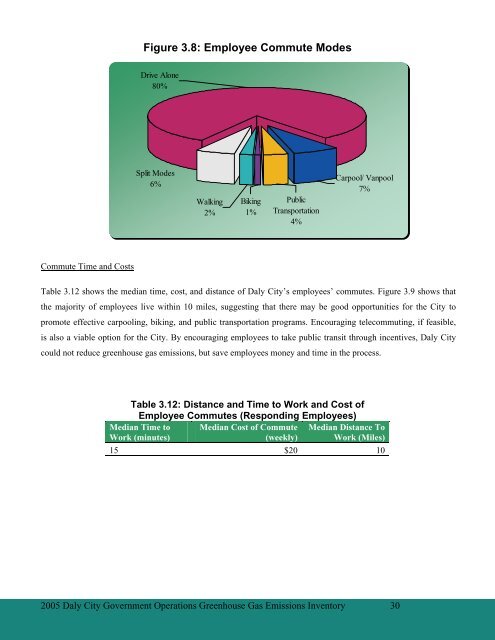
Figure 3.8: Employee Commute Modes<br />
Drive Alone<br />
80%<br />
Split Modes<br />
6%<br />
Walking<br />
2%<br />
Biking<br />
1%<br />
Public<br />
Transportation<br />
4%<br />
Carpool/ Vanpool<br />
7%<br />
Commute Time and Costs<br />
Table 3.12 shows the median time, cost, and distance <strong>of</strong> <strong>Daly</strong> <strong>City</strong>’s employees’ commutes. Figure 3.9 shows that<br />
the majority <strong>of</strong> employees live within 10 miles, suggesting that there may be good opportunities for the <strong>City</strong> to<br />
promote effective carpooling, biking, and public transportation programs. Encouraging telecommuting, if feasible,<br />
is also a viable option for the <strong>City</strong>. By encouraging employees to take public transit through incentives, <strong>Daly</strong> <strong>City</strong><br />
could not reduce greenhouse gas emissions, but save employees money and time in the process.<br />
Table 3.12: Distance and Time to Work and Cost <strong>of</strong><br />
Employee Commutes (Responding Employees)<br />
Median Cost <strong>of</strong> Commute<br />
(weekly)<br />
Median Time to<br />
Work (minutes)<br />
Median Distance To<br />
Work (Miles)<br />
15 $20 10<br />
2005 <strong>Daly</strong> <strong>City</strong> Government Operations <strong>Green</strong>house Gas Emissions Inventory 30