Daly City's Green Vision - City of Daly City
Daly City's Green Vision - City of Daly City
Daly City's Green Vision - City of Daly City

Create successful ePaper yourself
Turn your PDF publications into a flip-book with our unique Google optimized e-Paper software.
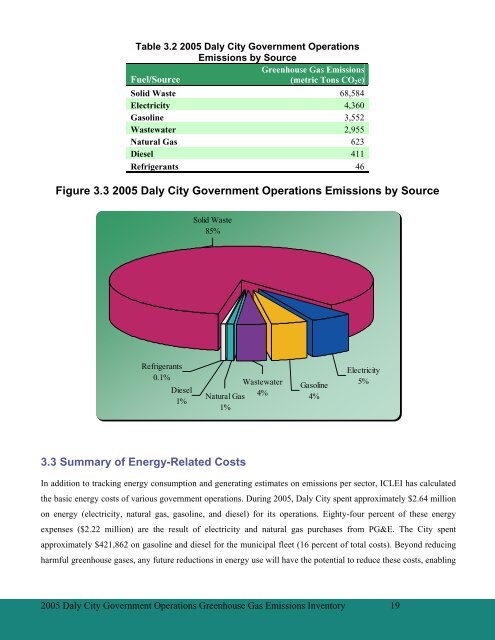
Table 3.2 2005 <strong>Daly</strong> <strong>City</strong> Government Operations<br />
Emissions by Source<br />
<strong>Green</strong>house Gas Emissions<br />
Fuel/Source<br />
(metric Tons CO 2 e)<br />
Solid Waste 68,584<br />
Electricity 4,360<br />
Gasoline 3,552<br />
Wastewater 2,955<br />
Natural Gas 623<br />
Diesel 411<br />
Refrigerants 46<br />
Figure 3.3 2005 <strong>Daly</strong> <strong>City</strong> Government Operations Emissions by Source<br />
Solid Waste<br />
85%<br />
Refrigerants<br />
0.1%<br />
Diesel<br />
1%<br />
Wastewater<br />
4%<br />
Natural Gas<br />
1%<br />
Gasoline<br />
4%<br />
Electricity<br />
5%<br />
3.3 Summary <strong>of</strong> Energy-Related Costs<br />
In addition to tracking energy consumption and generating estimates on emissions per sector, ICLEI has calculated<br />
the basic energy costs <strong>of</strong> various government operations. During 2005, <strong>Daly</strong> <strong>City</strong> spent approximately $2.64 million<br />
on energy (electricity, natural gas, gasoline, and diesel) for its operations. Eighty-four percent <strong>of</strong> these energy<br />
expenses ($2.22 million) are the result <strong>of</strong> electricity and natural gas purchases from PG&E. The <strong>City</strong> spent<br />
approximately $421,862 on gasoline and diesel for the municipal fleet (16 percent <strong>of</strong> total costs). Beyond reducing<br />
harmful greenhouse gases, any future reductions in energy use will have the potential to reduce these costs, enabling<br />
2005 <strong>Daly</strong> <strong>City</strong> Government Operations <strong>Green</strong>house Gas Emissions Inventory 19