Daly City's Green Vision - City of Daly City
Daly City's Green Vision - City of Daly City
Daly City's Green Vision - City of Daly City

You also want an ePaper? Increase the reach of your titles
YUMPU automatically turns print PDFs into web optimized ePapers that Google loves.
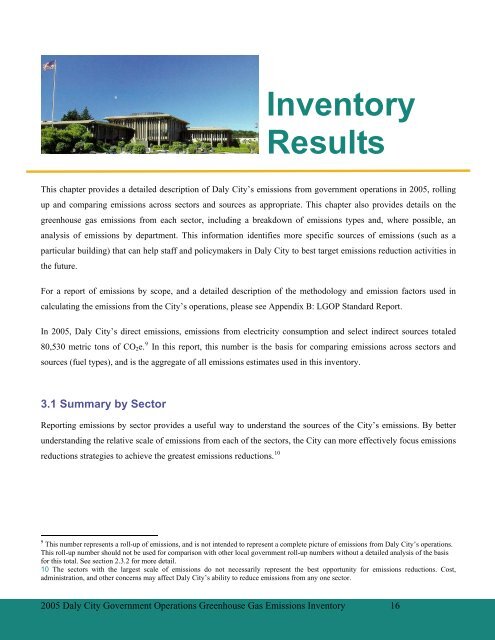
Inventory<br />
Results<br />
This chapter provides a detailed description <strong>of</strong> <strong>Daly</strong> <strong>City</strong>’s emissions from government operations in 2005, rolling<br />
up and comparing emissions across sectors and sources as appropriate. This chapter also provides details on the<br />
greenhouse gas emissions from each sector, including a breakdown <strong>of</strong> emissions types and, where possible, an<br />
analysis <strong>of</strong> emissions by department. This information identifies more specific sources <strong>of</strong> emissions (such as a<br />
particular building) that can help staff and policymakers in <strong>Daly</strong> <strong>City</strong> to best target emissions reduction activities in<br />
the future.<br />
For a report <strong>of</strong> emissions by scope, and a detailed description <strong>of</strong> the methodology and emission factors used in<br />
calculating the emissions from the <strong>City</strong>’s operations, please see Appendix B: LGOP Standard Report.<br />
In 2005, <strong>Daly</strong> <strong>City</strong>’s direct emissions, emissions from electricity consumption and select indirect sources totaled<br />
80,530 metric tons <strong>of</strong> CO 2 e. 9 In this report, this number is the basis for comparing emissions across sectors and<br />
sources (fuel types), and is the aggregate <strong>of</strong> all emissions estimates used in this inventory.<br />
3.1 Summary by Sector<br />
Reporting emissions by sector provides a useful way to understand the sources <strong>of</strong> the <strong>City</strong>’s emissions. By better<br />
understanding the relative scale <strong>of</strong> emissions from each <strong>of</strong> the sectors, the <strong>City</strong> can more effectively focus emissions<br />
reductions strategies to achieve the greatest emissions reductions. 10<br />
9 This number represents a roll-up <strong>of</strong> emissions, and is not intended to represent a complete picture <strong>of</strong> emissions from <strong>Daly</strong> <strong>City</strong>’s operations.<br />
This roll-up number should not be used for comparison with other local government roll-up numbers without a detailed analysis <strong>of</strong> the basis<br />
for this total. See section 2.3.2 for more detail.<br />
10 The sectors with the largest scale <strong>of</strong> emissions do not necessarily represent the best opportunity for emissions reductions. Cost,<br />
administration, and other concerns may affect <strong>Daly</strong> <strong>City</strong>’s ability to reduce emissions from any one sector.<br />
2005 <strong>Daly</strong> <strong>City</strong> Government Operations <strong>Green</strong>house Gas Emissions Inventory 16