Daly City's Green Vision - City of Daly City
Daly City's Green Vision - City of Daly City
Daly City's Green Vision - City of Daly City

Create successful ePaper yourself
Turn your PDF publications into a flip-book with our unique Google optimized e-Paper software.
To calculate emissions, <strong>Daly</strong> <strong>City</strong> administered a survey to all <strong>of</strong> its employees regarding their commute patterns<br />
and preferences. ICLEI then extrapolated the results <strong>of</strong> the survey to represent emissions from all employees. See<br />
Appendix C for a detailed description <strong>of</strong> the survey and methods used to calculate emissions.<br />
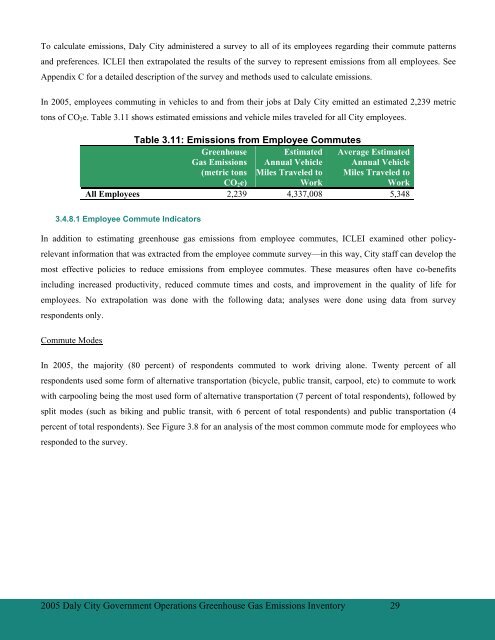
In 2005, employees commuting in vehicles to and from their jobs at <strong>Daly</strong> <strong>City</strong> emitted an estimated 2,239 metric<br />
tons <strong>of</strong> CO 2 e. Table 3.11 shows estimated emissions and vehicle miles traveled for all <strong>City</strong> employees.<br />
Table 3.11: Emissions from Employee Commutes<br />
<strong>Green</strong>house<br />
Gas Emissions<br />
(metric tons<br />
CO 2 e)<br />
Estimated<br />
Annual Vehicle<br />
Miles Traveled to<br />
Work<br />
Average Estimated<br />
Annual Vehicle<br />
Miles Traveled to<br />
Work<br />
All Employees 2,239 4,337,008 5,348<br />
3.4.8.1 Employee Commute Indicators<br />
In addition to estimating greenhouse gas emissions from employee commutes, ICLEI examined other policyrelevant<br />
information that was extracted from the employee commute survey—in this way, <strong>City</strong> staff can develop the<br />
most effective policies to reduce emissions from employee commutes. These measures <strong>of</strong>ten have co-benefits<br />
including increased productivity, reduced commute times and costs, and improvement in the quality <strong>of</strong> life for<br />
employees. No extrapolation was done with the following data; analyses were done using data from survey<br />
respondents only.<br />
Commute Modes<br />
In 2005, the majority (80 percent) <strong>of</strong> respondents commuted to work driving alone. Twenty percent <strong>of</strong> all<br />
respondents used some form <strong>of</strong> alternative transportation (bicycle, public transit, carpool, etc) to commute to work<br />
with carpooling being the most used form <strong>of</strong> alternative transportation (7 percent <strong>of</strong> total respondents), followed by<br />
split modes (such as biking and public transit, with 6 percent <strong>of</strong> total respondents) and public transportation (4<br />
percent <strong>of</strong> total respondents). See Figure 3.8 for an analysis <strong>of</strong> the most common commute mode for employees who<br />
responded to the survey.<br />
2005 <strong>Daly</strong> <strong>City</strong> Government Operations <strong>Green</strong>house Gas Emissions Inventory 29