Magnetic Fields and Magnetic Diagnostics for Tokamak Plasmas
Magnetic Fields and Magnetic Diagnostics for Tokamak Plasmas
Magnetic Fields and Magnetic Diagnostics for Tokamak Plasmas

Create successful ePaper yourself
Turn your PDF publications into a flip-book with our unique Google optimized e-Paper software.
<strong>Magnetic</strong> fields <strong>and</strong> tokamak plasmas<br />
Alan Wootton<br />
⎡<br />
δ i<br />
= m θ i<br />
− r mn ⎛<br />
1 +β<br />
R<br />
I<br />
+ l i ⎞<br />
g<br />
⎝ 2⎠ sin ( θ ⎤<br />
i)<br />
⎣<br />
⎢<br />
⎦<br />
⎥ + nφ i<br />
+ δ 0<br />
+ 2πk i<br />
17.28<br />
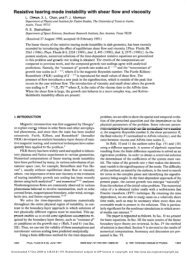
By per<strong>for</strong>ming a best fit of the measured phase with this expression gives m <strong>and</strong> n. For example<br />
plotting δ i -nφ i against θ i (to remove the toroidal effects) should give a line of slope m+1. An<br />
example is shown in Figure 17.6, data from PBX. The best fit to the data was obtained using m<br />
= 2, n = 1.<br />
Turbulence<br />
Figure 17.6. The phase of the experimental data shown in<br />
Figure 17.5, together with the phase given by equation 17.28.<br />
with m = 2, n = 1<br />
<strong>Magnetic</strong> coils outside the plasma measure not only the low m,n “Mirnov” oscillations (tearing<br />
modes), but also higher frequency, higher mode number fluctuations. Many m, n modes are<br />
possible; Figure 17.7 shows an example where 1 ≤ m ≤ 40, <strong>and</strong> 1 ≤ n ≤ 12 are considered.<br />
Each point represents a possible mode combination, the dark area shows those possible when q a<br />
= 3.2 , q 0 = 1, <strong>and</strong> constraints to m are applied (in this case 6 ≤ m ≤ 12).<br />
127