Fortification of Vegetable oil and Sugar with Vitamin A in Uganda
Fortification of Vegetable oil and Sugar with Vitamin A in Uganda
Fortification of Vegetable oil and Sugar with Vitamin A in Uganda

Create successful ePaper yourself
Turn your PDF publications into a flip-book with our unique Google optimized e-Paper software.
differences <strong>of</strong> household members. These differences, however, can be considered us<strong>in</strong>g<br />
the FAO “adult consumption equivalents” (ACEs) algorithms. By apply<strong>in</strong>g these<br />
algorithms (discussed <strong>in</strong> Annex 3), households consumption can be st<strong>and</strong>ardized by<br />
us<strong>in</strong>g the energy requirements <strong>of</strong> adult males.<br />
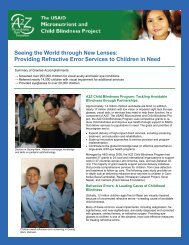
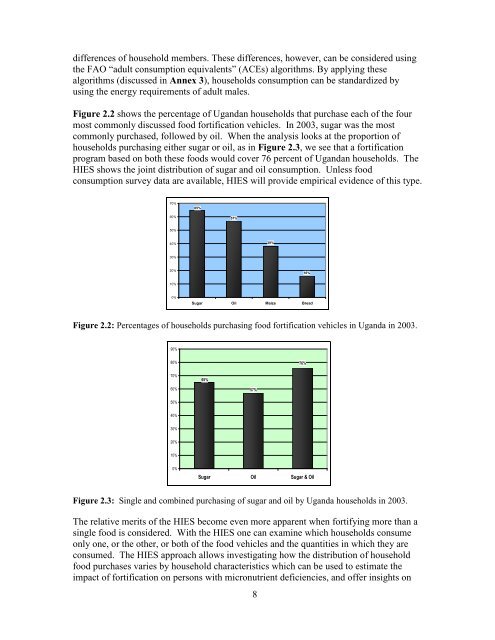
Figure 2.2 shows the percentage <strong>of</strong> Ug<strong>and</strong>an households that purchase each <strong>of</strong> the four<br />
most commonly discussed food fortification vehicles. In 2003, sugar was the most<br />
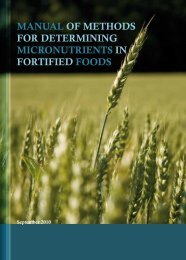
commonly purchased, followed by <strong>oil</strong>. When the analysis looks at the proportion <strong>of</strong><br />
households purchas<strong>in</strong>g either sugar or <strong>oil</strong>, as <strong>in</strong> Figure 2.3, we see that a fortification<br />
program based on both these foods would cover 76 percent <strong>of</strong> Ug<strong>and</strong>an households. The<br />
HIES shows the jo<strong>in</strong>t distribution <strong>of</strong> sugar <strong>and</strong> <strong>oil</strong> consumption. Unless food<br />
consumption survey data are available, HIES will provide empirical evidence <strong>of</strong> this type.<br />
70%<br />
65%<br />
60%<br />
57%<br />
50%<br />
40%<br />
38%<br />
30%<br />
20%<br />
16%<br />
10%<br />
0%<br />
<strong>Sugar</strong> Oil Maize Bread<br />
Figure 2.2: Percentages <strong>of</strong> households purchas<strong>in</strong>g food fortification vehicles <strong>in</strong> Ug<strong>and</strong>a <strong>in</strong> 2003.<br />
90%<br />
80%<br />
76%<br />
70%<br />
65%<br />
60%<br />
57%<br />
50%<br />
40%<br />
30%<br />
20%<br />
10%<br />
0%<br />
<strong>Sugar</strong> Oil <strong>Sugar</strong> & Oil<br />
Figure 2.3: S<strong>in</strong>gle <strong>and</strong> comb<strong>in</strong>ed purchas<strong>in</strong>g <strong>of</strong> sugar <strong>and</strong> <strong>oil</strong> by Ug<strong>and</strong>a households <strong>in</strong> 2003.<br />
The relative merits <strong>of</strong> the HIES become even more apparent when fortify<strong>in</strong>g more than a<br />
s<strong>in</strong>gle food is considered. With the HIES one can exam<strong>in</strong>e which households consume<br />
only one, or the other, or both <strong>of</strong> the food vehicles <strong>and</strong> the quantities <strong>in</strong> which they are<br />
consumed. The HIES approach allows <strong>in</strong>vestigat<strong>in</strong>g how the distribution <strong>of</strong> household<br />
food purchases varies by household characteristics which can be used to estimate the<br />
impact <strong>of</strong> fortification on persons <strong>with</strong> micronutrient deficiencies, <strong>and</strong> <strong>of</strong>fer <strong>in</strong>sights on<br />
8