Fortification of Vegetable oil and Sugar with Vitamin A in Uganda
Fortification of Vegetable oil and Sugar with Vitamin A in Uganda
Fortification of Vegetable oil and Sugar with Vitamin A in Uganda

You also want an ePaper? Increase the reach of your titles
YUMPU automatically turns print PDFs into web optimized ePapers that Google loves.
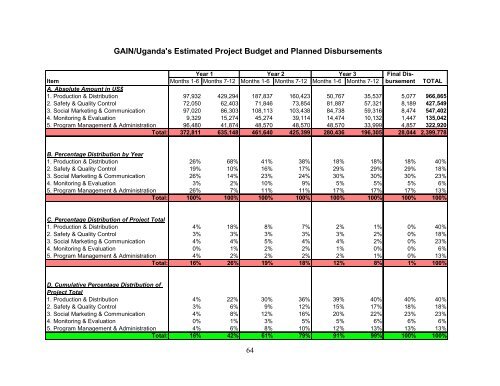
GAIN/Ug<strong>and</strong>a's Estimated Project Budget <strong>and</strong> Planned Disbursements<br />
Year 1 Year 2 Year 3<br />
F<strong>in</strong>al Dis-<br />
Item Months 1-6 Months 7-12 Months 1-6 Months 7-12 Months 1-6 Months 7-12 bursement TOTAL<br />
A. Absolute Amount <strong>in</strong> US$<br />
1. Production & Distribution 97,932 429,294 187,837 160,423 50,767 35,537 5,077 966,865<br />
2. Safety & Quality Control 72,050 62,403 71,846 73,854 81,887 57,321 8,189 427,549<br />
3. Social Market<strong>in</strong>g & Communication 97,020 86,303 108,113 103,438 84,738 59,316 8,474 547,402<br />
4. Monitor<strong>in</strong>g & Evaluation 9,329 15,274 45,274 39,114 14,474 10,132 1,447 135,042<br />
5. Program Management & Adm<strong>in</strong>istration 96,480 41,874 48,570 48,570 48,570 33,999 4,857 322,920<br />
Total: 372,811 635,148 461,640 425,399 280,436 196,305 28,044 2,399,778<br />
B. Percentage Distribution by Year<br />
1. Production & Distribution 26% 68% 41% 38% 18% 18% 18% 40%<br />
2. Safety & Quality Control 19% 10% 16% 17% 29% 29% 29% 18%<br />
3. Social Market<strong>in</strong>g & Communication 26% 14% 23% 24% 30% 30% 30% 23%<br />
4. Monitor<strong>in</strong>g & Evaluation 3% 2% 10% 9% 5% 5% 5% 6%<br />
5. Program Management & Adm<strong>in</strong>istration 26% 7% 11% 11% 17% 17% 17% 13%<br />
Total: 100% 100% 100% 100% 100% 100% 100% 100%<br />
C. Percentage Distribution <strong>of</strong> Project Total<br />
1. Production & Distribution 4% 18% 8% 7% 2% 1% 0% 40%<br />
2. Safety & Quality Control 3% 3% 3% 3% 3% 2% 0% 18%<br />
3. Social Market<strong>in</strong>g & Communication 4% 4% 5% 4% 4% 2% 0% 23%<br />
4. Monitor<strong>in</strong>g & Evaluation 0% 1% 2% 2% 1% 0% 0% 6%<br />
5. Program Management & Adm<strong>in</strong>istration 4% 2% 2% 2% 2% 1% 0% 13%<br />
Total: 16% 26% 19% 18% 12% 8% 1% 100%<br />
D. Cumulative Percentage Distribution <strong>of</strong><br />
Project Total<br />
1. Production & Distribution 4% 22% 30% 36% 39% 40% 40% 40%<br />
2. Safety & Quality Control 3% 6% 9% 12% 15% 17% 18% 18%<br />
3. Social Market<strong>in</strong>g & Communication 4% 8% 12% 16% 20% 22% 23% 23%<br />
4. Monitor<strong>in</strong>g & Evaluation 0% 1% 3% 5% 5% 6% 6% 6%<br />
5. Program Management & Adm<strong>in</strong>istration 4% 6% 8% 10% 12% 13% 13% 13%<br />
Total: 16% 42% 61% 79% 91% 99% 100% 100%<br />
64