Fortification of Vegetable oil and Sugar with Vitamin A in Uganda
Fortification of Vegetable oil and Sugar with Vitamin A in Uganda
Fortification of Vegetable oil and Sugar with Vitamin A in Uganda

Create successful ePaper yourself
Turn your PDF publications into a flip-book with our unique Google optimized e-Paper software.
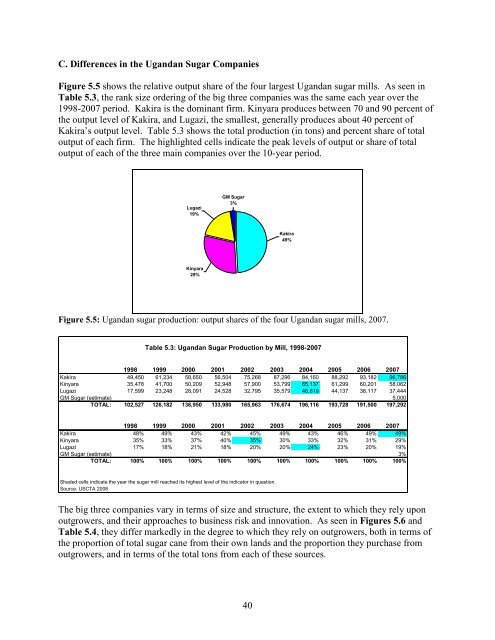
C. Differences <strong>in</strong> the Ug<strong>and</strong>an <strong>Sugar</strong> Companies<br />
Figure 5.5 shows the relative output share <strong>of</strong> the four largest Ug<strong>and</strong>an sugar mills. As seen <strong>in</strong><br />
Table 5.3, the rank size order<strong>in</strong>g <strong>of</strong> the big three companies was the same each year over the<br />
1998-2007 period. Kakira is the dom<strong>in</strong>ant firm. K<strong>in</strong>yara produces between 70 <strong>and</strong> 90 percent <strong>of</strong><br />
the output level <strong>of</strong> Kakira, <strong>and</strong> Lugazi, the smallest, generally produces about 40 percent <strong>of</strong><br />
Kakira’s output level. Table 5.3 shows the total production (<strong>in</strong> tons) <strong>and</strong> percent share <strong>of</strong> total<br />
output <strong>of</strong> each firm. The highlighted cells <strong>in</strong>dicate the peak levels <strong>of</strong> output or share <strong>of</strong> total<br />
output <strong>of</strong> each <strong>of</strong> the three ma<strong>in</strong> companies over the 10-year period.<br />
Lugazi<br />
19%<br />
GM <strong>Sugar</strong><br />
3%<br />
Kakira<br />
49%<br />
K<strong>in</strong>yara<br />
29%<br />
Figure 5.5: Ug<strong>and</strong>an sugar production: output shares <strong>of</strong> the four Ug<strong>and</strong>an sugar mills, 2007.<br />
Table 5.3: Ug<strong>and</strong>an <strong>Sugar</strong> Production by Mill, 1998-2007<br />
1998 1999 2000 2001 2002 2003 2004 2005 2006 2007<br />
Kakira 49,450 61,234 58,650 56,504 75,268 87,296 84,160 88,292 93,182 96,786<br />
K<strong>in</strong>yara 35,478 41,700 50,209 52,948 57,900 53,799 65,137 61,299 60,201 58,062<br />
Lugazi 17,599 23,248 28,091 24,528 32,795 35,579 46,819 44,137 38,117 37,444<br />
GM <strong>Sugar</strong> (estimate) 5,000<br />
TOTAL: 102,527 126,182 136,950 133,980 165,963 176,674 196,116 193,728 191,500 197,292<br />
1998 1999 2000 2001 2002 2003 2004 2005 2006 2007<br />
Kakira 48% 49% 43% 42% 45% 49% 43% 46% 49% 49%<br />
K<strong>in</strong>yara 35% 33% 37% 40% 35% 30% 33% 32% 31% 29%<br />
Lugazi 17% 18% 21% 18% 20% 20% 24% 23% 20% 19%<br />
GM <strong>Sugar</strong> (estimate) 3%<br />
TOTAL: 100% 100% 100% 100% 100% 100% 100% 100% 100% 100%<br />
Shaded cells <strong>in</strong>dicate the year the sugar mill reached its highest level <strong>of</strong> the <strong>in</strong>dicator <strong>in</strong> question.<br />
Source: USCTA 2008<br />
The big three companies vary <strong>in</strong> terms <strong>of</strong> size <strong>and</strong> structure, the extent to which they rely upon<br />
outgrowers, <strong>and</strong> their approaches to bus<strong>in</strong>ess risk <strong>and</strong> <strong>in</strong>novation. As seen <strong>in</strong> Figures 5.6 <strong>and</strong><br />
Table 5.4, they differ markedly <strong>in</strong> the degree to which they rely on outgrowers, both <strong>in</strong> terms <strong>of</strong><br />
the proportion <strong>of</strong> total sugar cane from their own l<strong>and</strong>s <strong>and</strong> the proportion they purchase from<br />
outgrowers, <strong>and</strong> <strong>in</strong> terms <strong>of</strong> the total tons from each <strong>of</strong> these sources.<br />
40