Fortification of Vegetable oil and Sugar with Vitamin A in Uganda
Fortification of Vegetable oil and Sugar with Vitamin A in Uganda
Fortification of Vegetable oil and Sugar with Vitamin A in Uganda

Create successful ePaper yourself
Turn your PDF publications into a flip-book with our unique Google optimized e-Paper software.
how to target other micronutrient <strong>in</strong>terventions to people not likely to be reached or<br />
adequately affected by fortification efforts. These important issues <strong>in</strong>fluence health <strong>and</strong><br />
nutrition program design <strong>and</strong> policy-mak<strong>in</strong>g.<br />
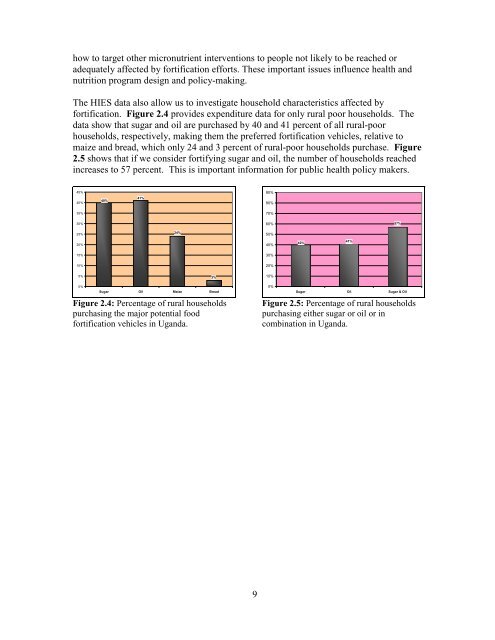
The HIES data also allow us to <strong>in</strong>vestigate household characteristics affected by<br />
fortification. Figure 2.4 provides expenditure data for only rural poor households. The<br />
data show that sugar <strong>and</strong> <strong>oil</strong> are purchased by 40 <strong>and</strong> 41 percent <strong>of</strong> all rural-poor<br />
households, respectively, mak<strong>in</strong>g them the preferred fortification vehicles, relative to<br />
maize <strong>and</strong> bread, which only 24 <strong>and</strong> 3 percent <strong>of</strong> rural-poor households purchase. Figure<br />
2.5 shows that if we consider fortify<strong>in</strong>g sugar <strong>and</strong> <strong>oil</strong>, the number <strong>of</strong> households reached<br />
<strong>in</strong>creases to 57 percent. This is important <strong>in</strong>formation for public health policy makers.<br />
45%<br />
40%<br />
40%<br />
41%<br />
90%<br />
80%<br />
35%<br />
70%<br />
30%<br />
60%<br />
57%<br />
25%<br />
24%<br />
50%<br />
20%<br />
40%<br />
40%<br />
41%<br />
15%<br />
30%<br />
10%<br />
20%<br />
5%<br />
3%<br />
10%<br />
0%<br />
<strong>Sugar</strong> Oil Maize Bread<br />
Figure 2.4: Percentage <strong>of</strong> rural households<br />
purchas<strong>in</strong>g the major potential food<br />
fortification vehicles <strong>in</strong> Ug<strong>and</strong>a.<br />
0%<br />
<strong>Sugar</strong> Oil <strong>Sugar</strong> & Oil<br />
Figure 2.5: Percentage <strong>of</strong> rural households<br />
purchas<strong>in</strong>g either sugar or <strong>oil</strong> or <strong>in</strong><br />
comb<strong>in</strong>ation <strong>in</strong> Ug<strong>and</strong>a.<br />
9