Fortification of Vegetable oil and Sugar with Vitamin A in Uganda
Fortification of Vegetable oil and Sugar with Vitamin A in Uganda
Fortification of Vegetable oil and Sugar with Vitamin A in Uganda

Create successful ePaper yourself
Turn your PDF publications into a flip-book with our unique Google optimized e-Paper software.
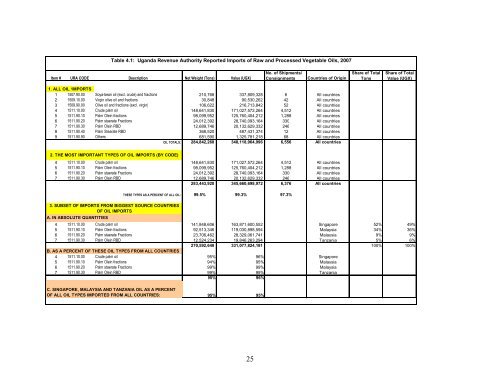
Table 4.1: Ug<strong>and</strong>a Revenue Authority Reported Imports <strong>of</strong> Raw <strong>and</strong> Processed <strong>Vegetable</strong> Oils, 2007<br />
Item # URA CODE Description Net Weight (Tons) Value (UGX)<br />
No. <strong>of</strong> Shipments/<br />
Consignments<br />
Countries <strong>of</strong> Orig<strong>in</strong><br />
Share <strong>of</strong> Total<br />
Tons<br />
Share <strong>of</strong> Total<br />
Value (UGX)<br />
1. ALL OIL 1MPORTS<br />
1 1507.90.00 Soya-bean <strong>oil</strong> (excl. crude) <strong>and</strong> fractions 210,768 337,809,328 6 All countries<br />
2 1509.10.00 Virg<strong>in</strong> olive <strong>oil</strong> <strong>and</strong> fractions 30,848 90,530,262 42 All countries<br />
3 1509.90.00 Olive <strong>oil</strong> <strong>and</strong> fractions (excl. virg<strong>in</strong>) 106,622 216,713,842 52 All countries<br />
4 1511.10.00 Crude palm <strong>oil</strong> 148,641,830 171,027,572,264 4,512 All countries<br />
5 1511.90.10 Palm Ole<strong>in</strong> fractions 98,099,952 125,760,404,212 1,288 All countries<br />
6 1511.90.20 Palm staerate Fractions 24,012,392 28,740,093,164 330 All countries<br />
7 1511.90.30 Palm Ole<strong>in</strong> RBD 12,689,746 20,132,629,332 246 All countries<br />
8 1511.90.40 Palm Stearate RBD 368,520 487,431,374 12 All countries<br />
9 1511.90.90 Others 681,590 1,325,781,218 68 All countries<br />
OIL TOTALS: 284,842,268 348,118,964,996 6,556 All countries<br />
2. THE MOST IMPORTANT TYPES OF OIL IMPORTS (BY CODE)<br />
4 1511.10.00 Crude palm <strong>oil</strong> 148,641,830 171,027,572,264 4,512 All countries<br />
5 1511.90.10 Palm Ole<strong>in</strong> fractions 98,099,952 125,760,404,212 1,288 All countries<br />
6 1511.90.20 Palm staerate Fractions 24,012,392 28,740,093,164 330 All countries<br />
7 1511.90.30 Palm Ole<strong>in</strong> RBD 12,689,746 20,132,629,332 246 All countries<br />
283,443,920 345,660,698,972 6,376 All countries<br />
3. SUBSET OF IMPORTS FROM BIGGEST SOURCE COUNTRIES<br />
OF OIL IMPORTS<br />
A. IN ABSOLUTE QUANTITIES<br />
THESE TYPES AS A PERCENT OF ALL OIL: 99.5% 99.3% 97.3%<br />
4 1511.10.00 Crude palm <strong>oil</strong> 141,848,606 163,871,600,552 S<strong>in</strong>gapore 52% 49%<br />
5 1511.90.10 Palm Ole<strong>in</strong> fractions 92,513,346 119,030,898,594 Malaysia 34% 36%<br />
6 1511.90.20 Palm staerate Fractions 23,706,462 28,329,061,741 Malaysia 9% 9%<br />
7 1511.90.30 Palm Ole<strong>in</strong> RBD 12,524,234 19,846,263,294 Tanzania 5% 6%<br />
270,592,648 331,077,824,181 100% 100%<br />
B. AS A PERCENT OF THESE OIL TYPES FROM ALL COUNTRIES<br />
4 1511.10.00 Crude palm <strong>oil</strong> 95% 96% S<strong>in</strong>gapore<br />
5 1511.90.10 Palm Ole<strong>in</strong> fractions 94% 95% Malaysia<br />
6 1511.90.20 Palm staerate Fractions 99% 99% Malaysia<br />
7 1511.90.30 Palm Ole<strong>in</strong> RBD 99% 99% Tanzania<br />
95% 96%<br />
C. SINGAPORE, MALAYSIA AND TANZANIA OIL AS A PERCENT<br />
OF ALL OIL TYPES IMPORTED FROM ALL COUNTRIES:<br />
95% 95%<br />
25