Vol 43 # 2 June 2011 - Kma.org.kw
Vol 43 # 2 June 2011 - Kma.org.kw
Vol 43 # 2 June 2011 - Kma.org.kw

Create successful ePaper yourself
Turn your PDF publications into a flip-book with our unique Google optimized e-Paper software.
100<br />
Quantitative Postural Sway Assessment by Computerized Dynamic Posturography ...<br />
<strong>June</strong> <strong>2011</strong><br />
sports and balance clinics, were recruited for this<br />
study. Information from medical chart reviews was<br />
linked with survey data to create the database for the<br />
analyses. The diagnosis of chronic ankle sprain was<br />
made through a careful examination. X-rays of the<br />
ankle were done to rule out any bony pathology.<br />
All the patients and the control group<br />
healthy individuals were evaluated clinically by<br />
musculoskeletal and neurological examination.<br />
Inclusion criterion for the trial included the ability<br />
to ambulate 25 feet independently. Exclusion criteria<br />
were the following: cognitive deficit; peripheral<br />
neuropathy; significant visual field defects; cerebellar<br />
or brain stem lesions; serious cardiac conditions; severe<br />
weight-bearing pain; and other serious <strong>org</strong>an and<br />
system disorders. After subjects passed the screening<br />
criteria, an informed consent was taken.<br />
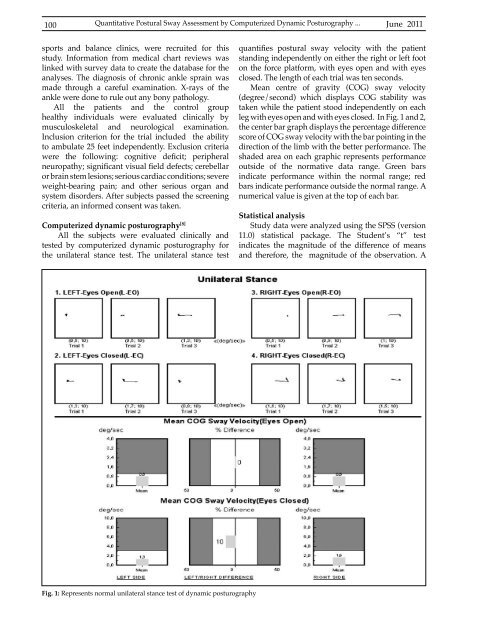
Computerized dynamic posturography [8]<br />
All the subjects were evaluated clinically and<br />
tested by computerized dynamic posturography for<br />
the unilateral stance test. The unilateral stance test<br />
quantifies postural sway velocity with the patient<br />
standing independently on either the right or left foot<br />
on the force platform, with eyes open and with eyes<br />
closed. The length of each trial was ten seconds.<br />
Mean centre of gravity (COG) sway velocity<br />
(degree/second) which displays COG stability was<br />
taken while the patient stood independently on each<br />
leg with eyes open and with eyes closed. In Fig. 1 and 2,<br />
the center bar graph displays the percentage difference<br />
score of COG sway velocity with the bar pointing in the<br />
direction of the limb with the better performance. The<br />
shaded area on each graphic represents performance<br />
outside of the normative data range. Green bars<br />
indicate performance within the normal range; red<br />
bars indicate performance outside the normal range. A<br />
numerical value is given at the top of each bar.<br />
Statistical analysis<br />
Study data were analyzed using the SPSS (version<br />
11.0) statistical package. The Student’s “t” test<br />
indicates the magnitude of the difference of means<br />
and therefore, the magnitude of the observation. A<br />
Fig. 1: Represents normal unilateral stance test of dynamic posturography