Report on the Implementation of the derogation to ... - Trade Websites
Report on the Implementation of the derogation to ... - Trade Websites
Report on the Implementation of the derogation to ... - Trade Websites

You also want an ePaper? Increase the reach of your titles
YUMPU automatically turns print PDFs into web optimized ePapers that Google loves.
Final <str<strong>on</strong>g>Report</str<strong>on</strong>g><br />
RoO Derogati<strong>on</strong> under <strong>the</strong> PACP-IEPA<br />
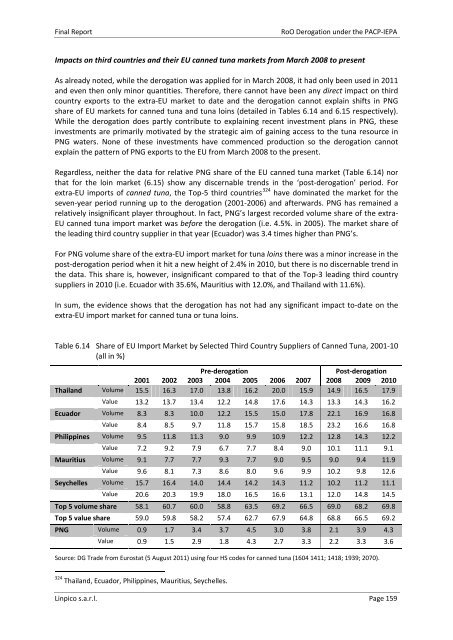
Impacts <strong>on</strong> third countries and <strong>the</strong>ir EU canned tuna markets from March 2008 <strong>to</strong> present<br />
As already noted, while <strong>the</strong> derogati<strong>on</strong> was applied for in March 2008, it had <strong>on</strong>ly been used in 2011<br />
and even <strong>the</strong>n <strong>on</strong>ly minor quantities. Therefore, <strong>the</strong>re cannot have been any direct impact <strong>on</strong> third<br />
country exports <strong>to</strong> <strong>the</strong> extra-EU market <strong>to</strong> date and <strong>the</strong> derogati<strong>on</strong> cannot explain shifts in PNG<br />
share <strong>of</strong> EU markets for canned tuna and tuna loins (detailed in Tables 6.14 and 6.15 respectively).<br />
While <strong>the</strong> derogati<strong>on</strong> does partly c<strong>on</strong>tribute <strong>to</strong> explaining recent investment plans in PNG, <strong>the</strong>se<br />
investments are primarily motivated by <strong>the</strong> strategic aim <strong>of</strong> gaining access <strong>to</strong> <strong>the</strong> tuna resource in<br />
PNG waters. N<strong>on</strong>e <strong>of</strong> <strong>the</strong>se investments have commenced producti<strong>on</strong> so <strong>the</strong> derogati<strong>on</strong> cannot<br />
explain <strong>the</strong> pattern <strong>of</strong> PNG exports <strong>to</strong> <strong>the</strong> EU from March 2008 <strong>to</strong> <strong>the</strong> present.<br />
Regardless, nei<strong>the</strong>r <strong>the</strong> data for relative PNG share <strong>of</strong> <strong>the</strong> EU canned tuna market (Table 6.14) nor<br />
that for <strong>the</strong> loin market (6.15) show any discernable trends in <strong>the</strong> ‘post-derogati<strong>on</strong>’ period. For<br />
extra-EU imports <strong>of</strong> canned tuna, <strong>the</strong> Top-5 third countries 324 have dominated <strong>the</strong> market for <strong>the</strong><br />
seven-year period running up <strong>to</strong> <strong>the</strong> derogati<strong>on</strong> (2001-2006) and afterwards. PNG has remained a<br />
relatively insignificant player throughout. In fact, PNG’s largest recorded volume share <strong>of</strong> <strong>the</strong> extra-<br />
EU canned tuna import market was before <strong>the</strong> derogati<strong>on</strong> (i.e. 4.5%. in 2005). The market share <strong>of</strong><br />
<strong>the</strong> leading third country supplier in that year (Ecuador) was 3.4 times higher than PNG’s.<br />
For PNG volume share <strong>of</strong> <strong>the</strong> extra-EU import market for tuna loins <strong>the</strong>re was a minor increase in <strong>the</strong><br />
post-derogati<strong>on</strong> period when it hit a new height <strong>of</strong> 2.4% in 2010, but <strong>the</strong>re is no discernable trend in<br />
<strong>the</strong> data. This share is, however, insignificant compared <strong>to</strong> that <strong>of</strong> <strong>the</strong> Top-3 leading third country<br />
suppliers in 2010 (i.e. Ecuador with 35.6%, Mauritius with 12.0%, and Thailand with 11.6%).<br />
In sum, <strong>the</strong> evidence shows that <strong>the</strong> derogati<strong>on</strong> has not had any significant impact <strong>to</strong>-date <strong>on</strong> <strong>the</strong><br />
extra-EU import market for canned tuna or tuna loins.<br />
Table 6.14 Share <strong>of</strong> EU Import Market by Selected Third Country Suppliers <strong>of</strong> Canned Tuna, 2001-10<br />
(all in %)<br />
Pre-derogati<strong>on</strong><br />
Post-derogati<strong>on</strong><br />
2001 2002 2003 2004 2005 2006 2007 2008 2009 2010<br />
Thailand Volume 15.5 16.3 17.0 13.8 16.2 20.0 15.9 14.9 16.5 17.9<br />
Value 13.2 13.7 13.4 12.2 14.8 17.6 14.3 13.3 14.3 16.2<br />
Ecuador Volume 8.3 8.3 10.0 12.2 15.5 15.0 17.8 22.1 16.9 16.8<br />
Value 8.4 8.5 9.7 11.8 15.7 15.8 18.5 23.2 16.6 16.8<br />
Philippines Volume 9.5 11.8 11.3 9.0 9.9 10.9 12.2 12.8 14.3 12.2<br />
Value 7.2 9.2 7.9 6.7 7.7 8.4 9.0 10.1 11.1 9.1<br />
Mauritius Volume 9.1 7.7 7.7 9.3 7.7 9.0 9.5 9.0 9.4 11.9<br />
Value 9.6 8.1 7.3 8.6 8.0 9.6 9.9 10.2 9.8 12.6<br />
Seychelles Volume 15.7 16.4 14.0 14.4 14.2 14.3 11.2 10.2 11.2 11.1<br />
Value 20.6 20.3 19.9 18.0 16.5 16.6 13.1 12.0 14.8 14.5<br />
Top 5 volume share 58.1 60.7 60.0 58.8 63.5 69.2 66.5 69.0 68.2 69.8<br />
Top 5 value share 59.0 59.8 58.2 57.4 62.7 67.9 64.8 68.8 66.5 69.2<br />
PNG Volume 0.9 1.7 3.4 3.7 4.5 3.0 3.8 2.1 3.9 4.3<br />
Value 0.9 1.5 2.9 1.8 4.3 2.7 3.3 2.2 3.3 3.6<br />
Source: DG <strong>Trade</strong> from Eurostat (5 August 2011) using four HS codes for canned tuna (1604 1411; 1418; 1939; 2070).<br />
324 Thailand, Ecuador, Philippines, Mauritius, Seychelles.<br />
Linpico s.a.r.l. Page 159