Tutorial.pdf
Tutorial.pdf
Tutorial.pdf

Create successful ePaper yourself
Turn your PDF publications into a flip-book with our unique Google optimized e-Paper software.
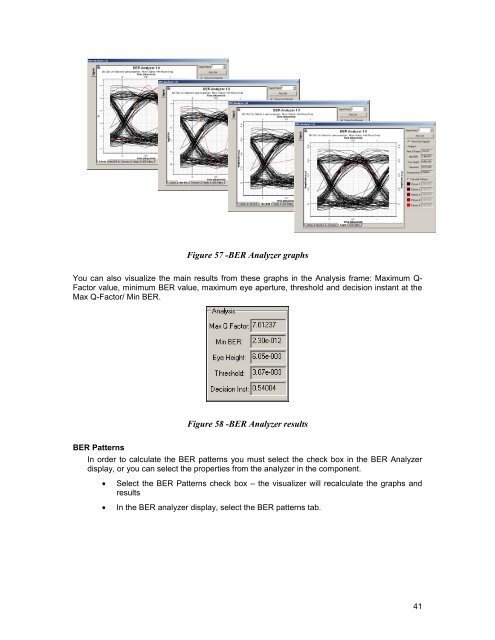
Figure 57 -BER Analyzer graphs<br />
You can also visualize the main results from these graphs in the Analysis frame: Maximum Q-<br />
Factor value, minimum BER value, maximum eye aperture, threshold and decision instant at the<br />
Max Q-Factor/ Min BER.<br />
Figure 58 -BER Analyzer results<br />
BER Patterns<br />
In order to calculate the BER patterns you must select the check box in the BER Analyzer<br />
display, or you can select the properties from the analyzer in the component.<br />
• Select the BER Patterns check box – the visualizer will recalculate the graphs and<br />
results<br />
• In the BER analyzer display, select the BER patterns tab.<br />
41