Tutorial.pdf
Tutorial.pdf
Tutorial.pdf

Create successful ePaper yourself
Turn your PDF publications into a flip-book with our unique Google optimized e-Paper software.
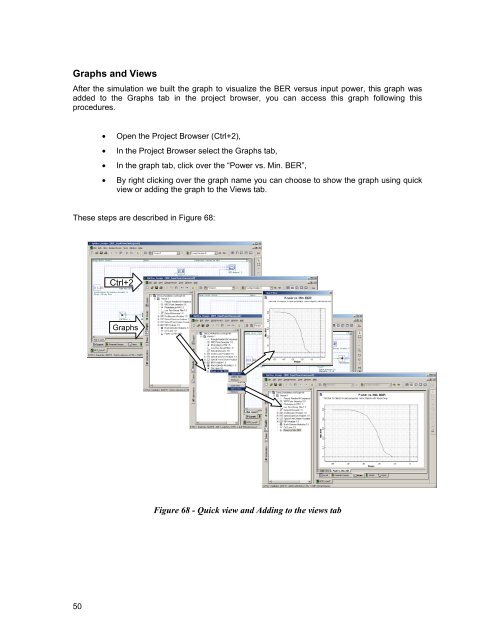
Graphs and Views<br />
After the simulation we built the graph to visualize the BER versus input power, this graph was<br />
added to the Graphs tab in the project browser, you can access this graph following this<br />
procedures.<br />
• Open the Project Browser (Ctrl+2),<br />
• In the Project Browser select the Graphs tab,<br />
• In the graph tab, click over the “Power vs. Min. BER”,<br />
• By right clicking over the graph name you can choose to show the graph using quick<br />
view or adding the graph to the Views tab.<br />
These steps are described in Figure 68:<br />
Ctrl+2<br />
Graphs<br />
Figure 68 - Quick view and Adding to the views tab<br />
50