TPF-I SWG Report - Exoplanet Exploration Program - NASA
TPF-I SWG Report - Exoplanet Exploration Program - NASA
TPF-I SWG Report - Exoplanet Exploration Program - NASA

Create successful ePaper yourself
Turn your PDF publications into a flip-book with our unique Google optimized e-Paper software.
C HAPTER 5<br />
a)<br />
c)<br />
b)<br />
d)<br />
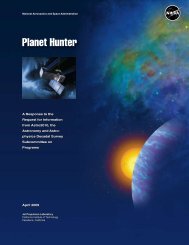
IWA = 43 mas OWA = 280 mas<br />
IWA = 9.6 mas OWA = 280 mas<br />
Figure 5-18. Response to planet emission at 10 μm for the stretched X-array. (a) Sky response for the<br />
minimum array size of 120 × 20 m at λ = 10 μm. (b) Section through the sky response for minimum<br />
array size. The IWA is 43 mas. The OWA is 280 mas. (c) Sky response for maximum array size (612<br />
× 102 m). (d) Section showing IWA of 9.6 mas.<br />
At the center of each response is the dark hole that represents the effect of the central null. The Inner<br />
Working Angle is defined to be the offset angle from the star at which the signal response (blue solid line)<br />
first crosses the asymptotic response (green dashed line), for a wavelength of 10 μm. This IWA scales<br />
approximately as B null -1 . At the minimum array size of 120 × 20 m, the IWA = 43 mas; at the maximum<br />
array size of 612 × 102 m, the IWA = 9.6 mas.<br />
Figure 5-18 shows the response to planet signal photons; this is not the same as the sensitivity to planet<br />
photons which depends on the signal-to-noise ratio. The noise sources described in Section 4.2 result in a<br />
statistically uniform distribution in the rms noise over the map. The noise level integrates down with time,<br />
so that the effective contrast that can be achieved scales with T int 1/2 . This is different from the<br />
coronagraph, which has a fixed contrast floor introduced by the instrument that ultimately limits the<br />
performance. For the interferometer, the powerful combination of fast phase chopping and spectral-fitting<br />
(described in Section 4.8) should ensure that any residual noise will be random in nature.<br />
118