TPF-I SWG Report - Exoplanet Exploration Program - NASA
TPF-I SWG Report - Exoplanet Exploration Program - NASA
TPF-I SWG Report - Exoplanet Exploration Program - NASA

You also want an ePaper? Increase the reach of your titles
YUMPU automatically turns print PDFs into web optimized ePapers that Google loves.
D ESIGN AND A R C H I T E C T U R E T RADE S TUDIES<br />
Measured<br />
X-Array, 2:1, L = 80 m, λ = 10 μm<br />
Template 2<br />
Template 1<br />
Template 3<br />
Template 4<br />
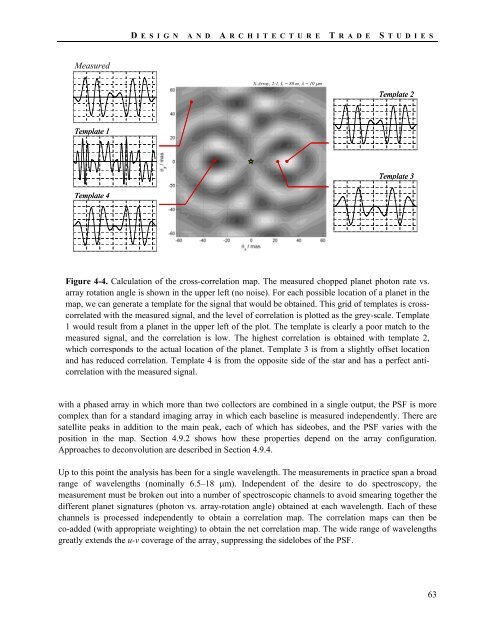
Figure 4-4. Calculation of the cross-correlation map. The measured chopped planet photon rate vs.<br />
array rotation angle is shown in the upper left (no noise). For each possible location of a planet in the<br />
map, we can generate a template for the signal that would be obtained. This grid of templates is crosscorrelated<br />
with the measured signal, and the level of correlation is plotted as the grey-scale. Template<br />
1 would result from a planet in the upper left of the plot. The template is clearly a poor match to the<br />
measured signal, and the correlation is low. The highest correlation is obtained with template 2,<br />
which corresponds to the actual location of the planet. Template 3 is from a slightly offset location<br />
and has reduced correlation. Template 4 is from the opposite side of the star and has a perfect anticorrelation<br />
with the measured signal.<br />
with a phased array in which more than two collectors are combined in a single output, the PSF is more<br />
complex than for a standard imaging array in which each baseline is measured independently. There are<br />
satellite peaks in addition to the main peak, each of which has sideobes, and the PSF varies with the<br />
position in the map. Section 4.9.2 shows how these properties depend on the array configuration.<br />
Approaches to deconvolution are described in Section 4.9.4.<br />
Up to this point the analysis has been for a single wavelength. The measurements in practice span a broad<br />
range of wavelengths (nominally 6.5–18 μm). Independent of the desire to do spectroscopy, the<br />
measurement must be broken out into a number of spectroscopic channels to avoid smearing together the<br />
different planet signatures (photon vs. array-rotation angle) obtained at each wavelength. Each of these<br />
channels is processed independently to obtain a correlation map. The correlation maps can then be<br />
co-added (with appropriate weighting) to obtain the net correlation map. The wide range of wavelengths<br />
greatly extends the u-v coverage of the array, suppressing the sidelobes of the PSF.<br />
63