TPF-I SWG Report - Exoplanet Exploration Program - NASA
TPF-I SWG Report - Exoplanet Exploration Program - NASA
TPF-I SWG Report - Exoplanet Exploration Program - NASA

Create successful ePaper yourself
Turn your PDF publications into a flip-book with our unique Google optimized e-Paper software.
C HAPTER 5<br />
30<br />
25<br />
5 M earth<br />
3 M earth<br />
All (1014)<br />
<strong>TPF</strong>-C [75 - 100%] (26)<br />
<strong>TPF</strong>-C [50 - 75%] (24)<br />
<strong>TPF</strong>-C [25 - 50%] (27)<br />
<strong>TPF</strong>-C [0 - 25%] (17)<br />
<strong>TPF</strong>-I [90%] (240)<br />
Series7<br />
10 M earth<br />
SIM (100 stars)<br />
Distance / pc<br />
20<br />
15<br />
2 M earth<br />
10<br />
Sun @ 10 pc<br />
5<br />
1 M earth<br />
0<br />
301 605<br />
0 50 100 150 200<br />
Projected radius of Inner Habitable Zone / mas<br />
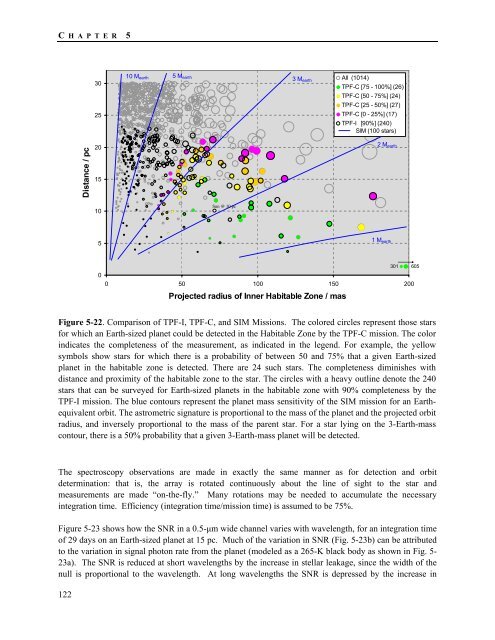
Figure 5-22. Comparison of <strong>TPF</strong>-I, <strong>TPF</strong>-C, and SIM Missions. The colored circles represent those stars<br />
for which an Earth-sized planet could be detected in the Habitable Zone by the <strong>TPF</strong>-C mission. The color<br />
indicates the completeness of the measurement, as indicated in the legend. For example, the yellow<br />
symbols show stars for which there is a probability of between 50 and 75% that a given Earth-sized<br />
planet in the habitable zone is detected. There are 24 such stars. The completeness diminishes with<br />
distance and proximity of the habitable zone to the star. The circles with a heavy outline denote the 240<br />
stars that can be surveyed for Earth-sized planets in the habitable zone with 90% completeness by the<br />
<strong>TPF</strong>-I mission. The blue contours represent the planet mass sensitivity of the SIM mission for an Earthequivalent<br />
orbit. The astrometric signature is proportional to the mass of the planet and the projected orbit<br />
radius, and inversely proportional to the mass of the parent star. For a star lying on the 3-Earth-mass<br />
contour, there is a 50% probability that a given 3-Earth-mass planet will be detected.<br />
The spectroscopy observations are made in exactly the same manner as for detection and orbit<br />
determination: that is, the array is rotated continuously about the line of sight to the star and<br />
measurements are made “on-the-fly.” Many rotations may be needed to accumulate the necessary<br />
integration time. Efficiency (integration time/mission time) is assumed to be 75%.<br />
Figure 5-23 shows how the SNR in a 0.5-μm wide channel varies with wavelength, for an integration time<br />
of 29 days on an Earth-sized planet at 15 pc. Much of the variation in SNR (Fig. 5-23b) can be attributed<br />
to the variation in signal photon rate from the planet (modeled as a 265-K black body as shown in Fig. 5-<br />
23a). The SNR is reduced at short wavelengths by the increase in stellar leakage, since the width of the<br />
null is proportional to the wavelength. At long wavelengths the SNR is depressed by the increase in<br />
122