Climate Change in Latin America - European Commission
Climate Change in Latin America - European Commission
Climate Change in Latin America - European Commission

Create successful ePaper yourself
Turn your PDF publications into a flip-book with our unique Google optimized e-Paper software.
From a broader po<strong>in</strong>t of view, a country's capacity for environmental management can be estimated by us<strong>in</strong>g<br />
different po<strong>in</strong>t systems.<br />
The Environmental Policies Index's po<strong>in</strong>ts system 24 was chosen for the opportunity that it provides of <strong>in</strong>creas<strong>in</strong>g<br />
the possibility of partnerships between EU <strong>in</strong>stitutions and its level of accessibility and validity for all of the<br />
18 countries.<br />
The calculations are important for <strong>Climate</strong> <strong>Change</strong> policies, but they are not sufficient. Therefore, evaluations have<br />
been made of the <strong>in</strong>stitutional capacity of the countries for deal<strong>in</strong>g with climate matters and the extent to which<br />
these matters have been <strong>in</strong>corporated <strong>in</strong>to the design of government policies. The environmental <strong>in</strong>dex provides<br />
the opportunity to supply reference <strong>in</strong>dicators as part of the project's process: the EUrocLIMA <strong>in</strong>itiative will be<br />
ma<strong>in</strong>ly based on rais<strong>in</strong>g awareness amongst decision-makers about the importance of bas<strong>in</strong>g policy design on<br />
reliable sources of <strong>in</strong>formation.<br />
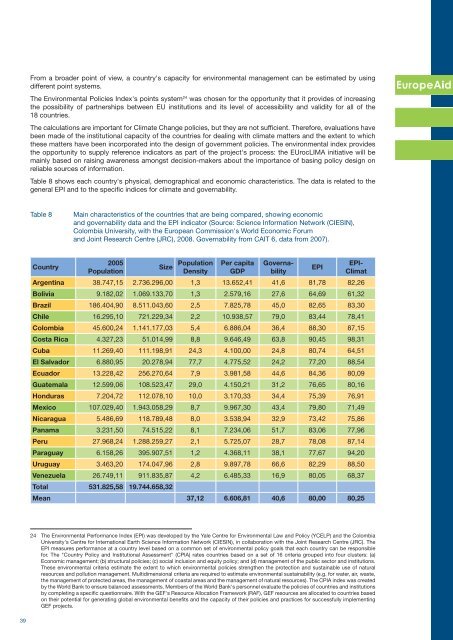
Table 8 shows each country's physical, demographical and economic characteristics. The data is related to the<br />
general EPI and to the specific <strong>in</strong>dices for climate and governability.<br />
Table 8<br />
Ma<strong>in</strong> characteristics of the countries that are be<strong>in</strong>g compared, show<strong>in</strong>g economic<br />
and governability data and the EPI <strong>in</strong>dicator (Source: Science Information Network (CIESIN),<br />
Colombia University, with the <strong>European</strong> <strong>Commission</strong>'s World Economic Forum<br />
and Jo<strong>in</strong>t Research Centre (JRC), 2008. Governability from CAIT 6, data from 2007).<br />
Country<br />
2005<br />
Population<br />
Size Population<br />
Density<br />
Per capita<br />
GDP<br />
EPI<br />
Governability<br />
EPI-<br />
Climat<br />
Argent<strong>in</strong>a 38.747,15 2.736.296,00 1,3 13.652,41 41,6 81,78 82,26<br />
Bolivia 9.182,02 1.069.133,70 1,3 2.579,16 27,6 64,69 61,32<br />
Brazil 186.404,90 8.511.043,60 2,5 7.825,78 45,0 82,65 83,30<br />
Chile 16.295,10 721.229,34 2,2 10.938,57 79,0 83,44 78,41<br />
Colombia 45.600,24 1.141.177,03 5,4 6.886,04 36,4 88,30 87,15<br />
Costa Rica 4.327,23 51.014,99 8,8 9.646,49 63,8 90,45 98,31<br />
Cuba 11.269,40 111.198,91 24,3 4.100,00 24,8 80,74 64,51<br />
El Salvador 6.880,95 20.278,94 77,7 4.775,52 24,2 77,20 88,54<br />
Ecuador 13.228,42 256.270,64 7,9 3.981,58 44,6 84,36 80,09<br />
Guatemala 12.599,06 108.523,47 29,0 4.150,21 31,2 76,65 80,16<br />
Honduras 7.204,72 112.078,10 10,0 3.170,33 34,4 75,39 76,91<br />
Mexico 107.029,40 1.943.058,29 8,7 9.967,30 43,4 79,80 71,49<br />
Nicaragua 5.486,69 118.789,48 8,0 3.538,94 32,9 73,42 75,86<br />
Panama 3.231,50 74.515,22 8,1 7.234,06 51,7 83,06 77,96<br />
Peru 27.968,24 1.288.259,27 2,1 5.725,07 28,7 78,08 87,14<br />
Paraguay 6.158,26 395.907,51 1,2 4.368,11 38,1 77,67 94,20<br />
Uruguay 3.463,20 174.047,96 2,8 9.897,78 66,6 82,29 88,50<br />
Venezuela 26.749,11 911.835,87 4,2 6.485,33 16,9 80,05 68,37<br />
Total 531.825,58 19.744.658,32<br />
Mean 37,12 6.606,81 40,6 80,00 80,25<br />
24 The Environmental Performance Index (EPI) was developed by the Yale Centre for Environmental Law and Policy (YCELP) and the Colombia<br />
University's Centre for International Earth Science Information Network (CIESIN), <strong>in</strong> collaboration with the Jo<strong>in</strong>t Research Centre (JRC). The<br />
EPI measures performance at a country level based on a common set of environmental policy goals that each country can be responsible<br />
for. The "Country Policy and Institutional Assessment" (CPIA) rates countries based on a set of 16 criteria grouped <strong>in</strong>to four clusters: (a)<br />
Economic management; (b) structural policies; (c) social <strong>in</strong>clusion and equity policy; and (d) management of the public sector and <strong>in</strong>stitutions.<br />
These environmental criteria estimate the extent to which environmental policies strengthen the protection and susta<strong>in</strong>able use of natural<br />
resources and pollution management. Multidimensional criteria are required to estimate environmental susta<strong>in</strong>ability (e.g. for water, air, waste,<br />
the management of protected areas, the management of coastal areas and the management of natural resources). The CPIA <strong>in</strong>dex was created<br />
by the World Bank to ensure balanced assessments. Members of the World Bank's personnel evaluate the policies of countries and <strong>in</strong>stitutions<br />
by complet<strong>in</strong>g a specific questionnaire. With the GEF's Resource Allocation Framework (RAF), GEF resources are allocated to countries based<br />
on their potential for generat<strong>in</strong>g global environmental benefits and the capacity of their policies and practices for successfully implement<strong>in</strong>g<br />
GEF projects.<br />
39