

The Interactive Whiteboards, Pedagogy and Pupil Performance ...
The Interactive Whiteboards, Pedagogy and Pupil Performance ...
The Interactive Whiteboards, Pedagogy and Pupil Performance ...

You also want an ePaper? Increase the reach of your titles
YUMPU automatically turns print PDFs into web optimized ePapers that Google loves.
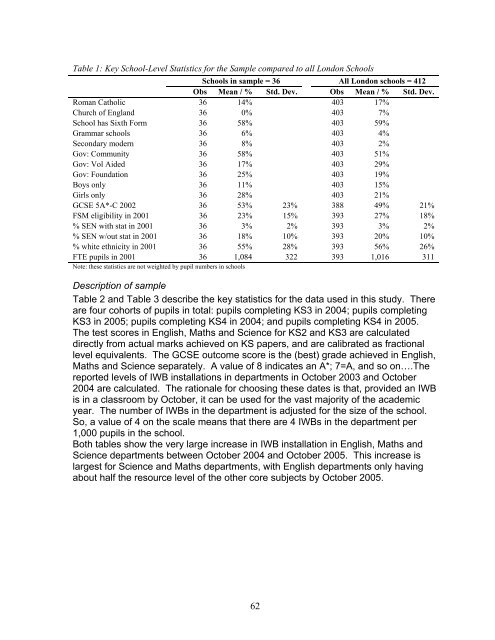
Table 1: Key School-Level Statistics for the Sample compared to all London Schools<br />
Schools in sample = 36 All London schools = 412<br />
Obs Mean / % Std. Dev. Obs Mean / % Std. Dev.<br />
Roman Catholic 36 14% 403 17%<br />
Church of Engl<strong>and</strong> 36 0% 403 7%<br />
School has Sixth Form 36 58% 403 59%<br />
Grammar schools 36 6% 403 4%<br />
Secondary modern 36 8% 403 2%<br />
Gov: Community 36 58% 403 51%<br />
Gov: Vol Aided 36 17% 403 29%<br />
Gov: Foundation 36 25% 403 19%<br />
Boys only 36 11% 403 15%<br />
Girls only 36 28% 403 21%<br />
GCSE 5A*-C 2002 36 53% 23% 388 49% 21%<br />
FSM eligibility in 2001 36 23% 15% 393 27% 18%<br />
% SEN with stat in 2001 36 3% 2% 393 3% 2%<br />
% SEN w/out stat in 2001 36 18% 10% 393 20% 10%<br />
% white ethnicity in 2001 36 55% 28% 393 56% 26%<br />
FTE pupils in 2001 36 1,084 322 393 1,016 311<br />
Note: these statistics are not weighted by pupil numbers in schools<br />
Description of sample<br />
Table 2 <strong>and</strong> Table 3 describe the key statistics for the data used in this study. <strong>The</strong>re<br />
are four cohorts of pupils in total: pupils completing KS3 in 2004; pupils completing<br />
KS3 in 2005; pupils completing KS4 in 2004; <strong>and</strong> pupils completing KS4 in 2005.<br />
<strong>The</strong> test scores in English, Maths <strong>and</strong> Science for KS2 <strong>and</strong> KS3 are calculated<br />
directly from actual marks achieved on KS papers, <strong>and</strong> are calibrated as fractional<br />
level equivalents. <strong>The</strong> GCSE outcome score is the (best) grade achieved in English,<br />
Maths <strong>and</strong> Science separately. A value of 8 indicates an A*; 7=A, <strong>and</strong> so on….<strong>The</strong><br />
reported levels of IWB installations in departments in October 2003 <strong>and</strong> October<br />
2004 are calculated. <strong>The</strong> rationale for choosing these dates is that, provided an IWB<br />
is in a classroom by October, it can be used for the vast majority of the academic<br />
year. <strong>The</strong> number of IWBs in the department is adjusted for the size of the school.<br />
So, a value of 4 on the scale means that there are 4 IWBs in the department per<br />
1,000 pupils in the school.<br />
Both tables show the very large increase in IWB installation in English, Maths <strong>and</strong><br />
Science departments between October 2004 <strong>and</strong> October 2005. This increase is<br />
largest for Science <strong>and</strong> Maths departments, with English departments only having<br />
about half the resource level of the other core subjects by October 2005.<br />
62


