- Page 1 and 2:
United States Office of Air and Rad
- Page 3 and 4:
NOTICE The following two-volume rep
- Page 5 and 6:
This publication is the result of a
- Page 7 and 8:
TO COMMENT ON THIS GUIDE OR PROVIDE
- Page 9 and 10:
CONTENTS NOTICE ...................
- Page 11 and 12:
Concentrations Extractable Iron Con
- Page 13 and 14:
Appendix A - Acronyms and Abbreviat
- Page 15 and 16:
Figure E.1. Variation of K d for Cr
- Page 17 and 18:
Table 5.16. Uranium(VI) aqueous spe
- Page 19 and 20:
Table H.3. Simple and multiple regr
- Page 21 and 22:
1.0 Introduction The objective of t
- Page 23 and 24:
discussed. The geochemical modeling
- Page 25 and 26:
2.0 The K d Model The simplest and
- Page 27 and 28:
track many more parameters and some
- Page 29 and 30:
of interest. The retardation factor
- Page 31 and 32:
(e.g., soil). An increasing body of
- Page 33 and 34:
complexation constants for the cont
- Page 35 and 36:
the soil column. Additionally, the
- Page 37 and 38:
Element Table 5.2. Concentrations o
- Page 39 and 40:
5.2.3 Aqueous Speciation Cadmium fo
- Page 41 and 42:
5.2.4 Dissolution/Precipitation/Cop
- Page 43 and 44:
cadmium, indicating that cadmium an
- Page 45 and 46:
5.2.6.2.2 Limits of K d Values with
- Page 47 and 48:
5.3.4 Dissolution/Precipitation/Cop
- Page 49 and 50:
organic chelates (e.g., EDTA). Init
- Page 51 and 52: 5.3.6.2.1 Limits of K d Values with
- Page 53 and 54: (tarapacaite) in chromium sludge fr
- Page 55 and 56: K d). Soils containing Mn oxides ox
- Page 57 and 58: Table 5.7. Estimated range of Kd va
- Page 59 and 60: most common valence state of lead e
- Page 61 and 62: Table 5.8. Lead aqueous species inc
- Page 63 and 64: Under reducing conditions, galena (
- Page 65 and 66: C Adsorption of lead increases with
- Page 67 and 68: 5.5.6.2.2 Limits of K d Values with
- Page 69 and 70: (Choppin, 1983). Plutonium hydrolyt
- Page 71 and 72: Table 5.10. Plutonium aqueous speci
- Page 73 and 74: 5.6.5 Sorption/Desorption Plutonium
- Page 75 and 76: content in the system. Additionally
- Page 77 and 78: 5.6.6.2.2 Limits of K d Values with
- Page 79 and 80: 5.7.4 Dissolution/Precipitation/Cop
- Page 81 and 82: much greater concentrations. Thus,
- Page 83 and 84: exchanged which they attributed to
- Page 85 and 86: up tables was based in part on thei
- Page 87 and 88: organic complexes likely predominat
- Page 89 and 90: Thorium undergoes hydrolysis in aqu
- Page 91 and 92: The distribution of thorium aqueous
- Page 93 and 94: from about 10 -8.5 mol/l (0.0007 mg
- Page 95 and 96: Based on the assumptions and limita
- Page 97 and 98: 5.10 Tritium Geochemistry And K d V
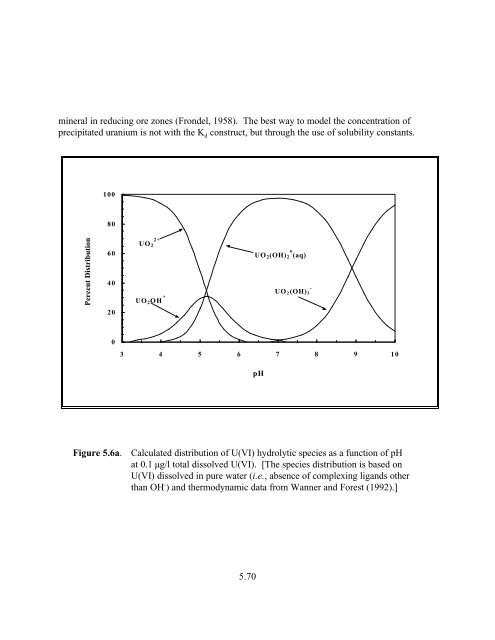
- Page 99 and 100: uranium. Uranium(VI) species domina
- Page 101: gives 0.1 to 10 µg/l as the range
- Page 105 and 106: Percent Distribution 100 80 60 40 2
- Page 107 and 108: 5.11.6 Partition Coefficient, K d ,
- Page 109 and 110: No attempt was made to statisticall
- Page 111 and 112: Table 5.18. Selected chemical and t
- Page 113 and 114: Another objective of this report is
- Page 115 and 116: 6.0 REFERENCES Adriano, D. C. 1992.
- Page 117 and 118: Bensen, D. W. 1960. Review of Soil
- Page 119 and 120: Metals by Geomedia. Variables, Mech
- Page 121 and 122: EPA (U.S. Environmental Protection
- Page 123 and 124: Griffin, R. A., A. K. Au, and R. R.
- Page 125 and 126: + Keeney-Kennicutt, W. L., and J. W
- Page 127 and 128: Mattigod, S. V., A. L. Page, and I.
- Page 129 and 130: Oscarson, D. W., and H. B. Hume. 19
- Page 131 and 132: Relyea, J. F. and D. A. Brown. 1978
- Page 133 and 134: Schultz, R. K., R. Overstreet, and
- Page 135 and 136: Szalay, A. 1964. “Cation Exchange
- Page 137 and 138: Yariv, S., and H. Cross. 1979. Geoc
- Page 139 and 140: APPENDIX A Acronyms, Abbreviations,
- Page 141 and 142: PC Personal computers operating und
- Page 143 and 144: A.3.0 List of Symbols and Notation
- Page 145 and 146: APPENDIX B Definitions
- Page 147 and 148: Clay Content - particle size fracti
- Page 149 and 150: Polynuclear Species - an aqueous sp
- Page 151 and 152: C.1.0 Background Appendix C Partiti
- Page 153 and 154:
Cadmium K d Table C.2. Correlation
- Page 155 and 156:
C.3.0 Data Set for Soils Table C.4
- Page 157 and 158:
Cd K d (ml/g) Clay Cont. (wt%) pH C
- Page 159 and 160:
Cd K d (ml/g) Clay Cont. (wt%) pH C
- Page 161 and 162:
Cd K d (ml/g) Clay Cont. (wt%) pH C
- Page 163 and 164:
Cd K d (ml/g) Clay Cont. (wt%) pH C
- Page 165 and 166:
Cd K d (ml/g) Clay Cont. (wt%) pH C
- Page 167 and 168:
D.1.0 Background Appendix D Partiti
- Page 169 and 170:
A second data set (see Section D.4)
- Page 171 and 172:
Table D.3. Correlation coefficients
- Page 173 and 174:
By transposing the CEC and cesium K
- Page 175 and 176:
Table D.6. Cesium K d values measur
- Page 177 and 178:
eported in Table D.8 are described
- Page 179 and 180:
a 1 b 1 Range of Solution Cs Concen
- Page 181 and 182:
Figure D.4. Generalized cesium Freu
- Page 183 and 184:
Table D.10. Estimated range of K d
- Page 185 and 186:
D.3.0 K d Data Set for Soils and Pu
- Page 187 and 188:
Cesium Kd (ml/g) Clay (wt.% ) Mica
- Page 189 and 190:
Cesium Kd (ml/g) Clay (wt.% ) Mica
- Page 191 and 192:
Cesium Kd (ml/g) Clay (wt.% ) Mica
- Page 193 and 194:
Cesium K d (ml/g) Clay (wt%) Mica (
- Page 195 and 196:
Bruggenwert, M. G. M., and A. Kamph
- Page 197 and 198:
Shiao, S. Y., P. Rafferty, R. E. Me
- Page 199 and 200:
E.1.0 Background Appendix E Partiti
- Page 201 and 202:
chromium-reductive soils may stem f
- Page 204 and 205:
E.2.0 Approach The approach used to
- Page 206 and 207:
Table E.3. Estimated range of K d v
- Page 208 and 209:
Table E.4. Data from Rai et al. (19
- Page 210 and 211:
E.4.0 References Davis, J. A. and J
- Page 212 and 213:
APPENDIX F Partition Coefficients F
- Page 214 and 215:
(CEC) of the soils. Such an anomaly
- Page 216 and 217:
Table F.1. Summary of K d values fo
- Page 218 and 219:
Figure F.2. Variation of K d as a f
- Page 220 and 221:
F.4.0 References Abd-Elfattah, A.,
- Page 222 and 223:
APPENDIX G Partition Coefficients F
- Page 224 and 225:
A number of investigators have exam
- Page 226 and 227:
pH value, which is typical of the m
- Page 228 and 229:
These significant reductions in ads
- Page 230 and 231:
This is typically accomplished by t
- Page 232 and 233:
The scatterplots are typically disp
- Page 234 and 235:
Table G.2. Regression models for pl
- Page 236 and 237:
G.4.0 References Barney, G. S. 1984
- Page 238 and 239:
Nelson, D. M., R. P. Larson, and W.
- Page 240 and 241:
APPENDIX H Partition Coefficients F
- Page 242 and 243:
1.6 ml/g for a measurement made on
- Page 244 and 245:
Figure H.1. Relation between stront
- Page 246 and 247:
Figure H.2. Relation between stront
- Page 248 and 249:
H.2.4 Approach Figure H.4. Relation
- Page 250 and 251:
A second look-up table (Table H.5)
- Page 252 and 253:
Sr K d (ml/g) Clay Content (%) pH C
- Page 254 and 255:
Sr K d (ml/g) Clay Content (%) pH C
- Page 256 and 257:
Sr K d (ml/g) Clay Conten t (%) pH
- Page 258 and 259:
Sr K d (ml/g) Clay Conten t (%) pH
- Page 260 and 261:
Sr K d (ml/g) Clay Conten t (%) pH
- Page 262 and 263:
Sr K d (ml/g) Clay Conten t (%) pH
- Page 264 and 265:
Konishi, M., K. Yamamoto, T. Yanagi
- Page 266 and 267:
APPENDIX I Partition Coefficients F
- Page 268 and 269:
descriptive statistics of the thori
- Page 270 and 271:
Figure I.1. Linear regression betwe
- Page 272 and 273:
The look-up table (Table I.5) for t
- Page 274 and 275:
Thorium K d (ml/g) pH Clay (wt.%) C
- Page 276 and 277:
Rai, D., A. R. Felmy, D. A. Moore,
- Page 278 and 279:
J.1.0 Background Appendix J Partiti
- Page 280 and 281:
J.2.2 Uranium K d Studies on Soils
- Page 282 and 283:
Washington. The studies included an
- Page 284 and 285:
and then decreases with increasing
- Page 286 and 287:
Kd (ml/g) 100,000 10,000 1,000 100
- Page 288 and 289:
papers. Warnecke et al. (1984) indi
- Page 290 and 291:
Anderson et al. (1982) summarize an
- Page 292 and 293:
McKinley and Scholtis (1993) compar
- Page 294 and 295:
In a similar comparison of sorption
- Page 296 and 297:
J.3.1 K d Values as a Function ff p
- Page 298 and 299:
discussed, and one would have to ma
- Page 300 and 301:
al., 1992; and others). These refer
- Page 302 and 303:
· Manskaya et al. (1956) studied a
- Page 304 and 305:
concentrations of humic acid, there
- Page 306 and 307:
pH U Kd (ml/g) Clay Cont. (wt.%) CE
- Page 308 and 309:
pH U Kd (ml/g) Clay Cont. (wt.%) CE
- Page 310 and 311:
pH U Kd (ml/g) Clay Cont. (wt.%) CE
- Page 312 and 313:
pH U Kd (ml/g) Clay Cont. (wt.%) CE
- Page 314 and 315:
pH U Kd (ml/g) Clay Cont. (wt.%) CE
- Page 316 and 317:
pH U Kd (ml/g) Clay Cont. (wt.%) CE
- Page 318 and 319:
pH U Kd (ml/g) Clay Cont. (wt.%) CE
- Page 320 and 321:
pH U Kd (ml/g) Clay Cont. (wt.%) CE
- Page 322 and 323:
pH U Kd (ml/g) Clay Cont. (wt.%) CE
- Page 324 and 325:
pH U Kd (ml/g) Clay Cont. (wt.%) CE
- Page 326 and 327:
J.6.0 References Ames, L. L., J. E.
- Page 328 and 329:
Erikson, R. L., C. J. Hostetler, R.
- Page 330 and 331:
R. C. Ewing. Materials Research Soc
- Page 332 and 333:
Sheppard, M. I., and D. H. Thibault
- Page 334:
Yamamoto, T., E. Yunoki, M. Yamakaw