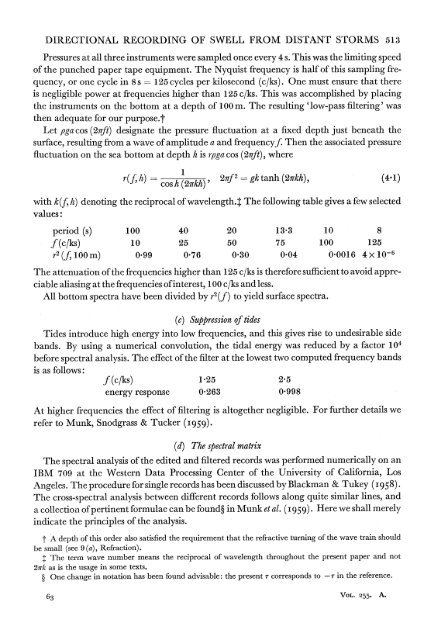
DIRECTIONAL RECORDING OF SWELL FROM DISTANI STORMS 513Pressures at all three instruments were sampled once every 4 s. This was the limiting speed<strong>of</strong> the punched paper tape equipment. The Nyquist frequency is half <strong>of</strong> this sampling frequency,or one cycle in 8 s = 125 cycles per kilosecond (c/ks). One must ensure that thereis negligible power at frequencies higher than 125 c/ks. This was accomplished by placingthe instruments on the bottom at a depth <strong>of</strong> 100 m. The resulting 'low-pass filtering' wasthen adequate for our purpose.tLet pga cos (2irft) designate the pressure fluctuation at a fixed depth just beneath thesurface, resulting <strong>from</strong> a wave <strong>of</strong> amplitude a and frequencyf. Then the associated pressurefluctuation on the sea bottom at depth h is rpga cos (2fft), wherer(f, h) os 1 27f2 ggktanh(2Irkh), (4.1)r(,)cos h(2-ffkh)'with k(f, h) denoting the reciprocal <strong>of</strong> wavelength.4 The following table gives a few selectedvalues:period (s) 100 40 20 13-3 10 8f (c/ks) 10 25 50 75 100 125r2 (f lOOm) 0.99 0-76 0 30 0 04 0-0016 4 x 10⁻⁶The attenuation <strong>of</strong> the frequencies higher than 125 c/ks is therefore sufficient to avoid appreciablealiasing at the frequencies <strong>of</strong>interest, 100 c/ks and less.All bottom spectra have been divided by r2(f) to yield surface spectra.(c) Suppression <strong>of</strong> tidesTides introduce high energy into low frequencies, and this gives rise to undesirable sidebands. By using a numerical convolution, the tidal energy was reduced by a factor 104before spectral analysis. The effect <strong>of</strong> the filter at the lowest two computed frequency bandsis as follows:f (c/ks) 1b25 25energy response 0-263 0-998At higher frequencies the effect <strong>of</strong> filtering is altogether negligible. For further details werefer to Munk, Snodgrass & Tucker (I959).(d) The spectral matrixThe spectral analysis <strong>of</strong> the edited and filtered records was performed numerically on anIBM 709 at the Western Data Processing Center <strong>of</strong> the University <strong>of</strong> California, LosAngeles. The procedure for single records has been discussed by Blackman & Tukey (1958).The cross-spectral analysis between different records follows along quite similar lines, anda collection <strong>of</strong> pertinent formulae can be found? in Munk et al. (I 959). Here we shall merelyindicate the principles <strong>of</strong> the analysis.t A depth <strong>of</strong> this order also satisfied the requirement that the refractive turning <strong>of</strong> the wave train shouldbe small (see 9(a), Refraction).+ The term wave number means the reciprocal <strong>of</strong> wavelength throughout the present paper and not27Tk as is the usage in some texts.? One change in notation has been found advisable: the present r corresponds to - T in the reference.63 VOL. 255. A.
514 W. H. MUNK, G. R. MILLER, F. E. SNODGRASS AND N. F. BARBERLet q,(t), q,(t) designate any two time series. The time averageN, (r) = 7, (t) q, (t +,r. (4 2)is called the covariance <strong>of</strong> the two series, andCrs (f)p , (T) cos 2nqfr dr,_c0o (4-3)Qrs(f) f_ Prs(T) sin 2irfr dr,are associated co- and quadrature spectra. For the special case <strong>of</strong> r s we have Qrr(f) 0,and Crr(f) is then known as the power spectrum.In general we may wish to refer to the cross-spectral matrixSrs (f) -Crs (f) - iQrs (f).(4)4)In our case we perform all possible cross-spectra between the records <strong>from</strong> the three instruments(figure 1). The result can be visualized as a 3 x 3 complex matrix, Srs(f), at each frequencyband. The matrix is Hermitian, Srs S*r. The three diagonal terms are real andrepresent the power spectra. This leaves nine real numbers to describe the matrix at eachfrequency. But the three power spectra are essentially identical, so that there are only sevenindependent numbers at each frequency band.In the case <strong>of</strong> a triangular array it is convenient to adopt a single subscript notation (thiswould not be convenient for more elaborate arrays):spectrum:(CSSCNNC~CWW)T,C0co-spectra: C1 = CNW, C2 = CWS, C3 CSN4 (4.5)quadrature spectra: Ql - QNW) Q2 -QWS) Q3 QSN)where the subscripts S, N, W, refer to the three instruments (inset, figure 1). The symmetry<strong>of</strong> the notation is apparent. The cross-spectral matrix is made up <strong>from</strong> seven independentparameters at each frequency band C0, C1, C2, C3, Q1l Q2, Q3. For each day's recording theparameters were computed for 101 frequency bands, extending in equal intervals <strong>from</strong> zer<strong>of</strong>requency to 125 c/ks. The resulting 707 numbers are the starting point <strong>of</strong> all subsequentanalyses.For plotting the results one usually finds it more satisfactory to refer to the coherence, R,and the phase, 0, defined byCrs(f) = [Crr(f) Css(f)] Rrs(f) COS Ors(f)) l (4.6)Qrs(f) -[Crr(f) Css(f)] Rrs(f) sin ?)rs(f) Jso that RrC iPrs Crs QrsWith this convention, O5rs(f) is the phase <strong>of</strong> qs(t) minus the phase <strong>of</strong> qr(t) at frequencyf.(e) The reliability <strong>of</strong> the computed spectraA typical record consisted <strong>of</strong> 31 h <strong>of</strong> values at intervals <strong>of</strong> At = 4 s, or a total <strong>of</strong> about 3000values. Spectral estimates were obtained at frequenciesWe used m =100, At =4s; hence Af-1P25c/ks. The degrees <strong>of</strong> freedom associated with
- Page 1 and 2: Directional Recording of Swell from
- Page 3 and 4: 506 W. H. MUNK, G. R. MILLER, F. E.
- Page 5 and 6: 508 W. H. MUNK, G. R. MILLER, F. E.
- Page 7 and 8: 510 W. H. MUNK, G. R. MILLER, F. E.
- Page 9: 512 W. H. MUNK, G. R. MILLER, F. E.
- Page 13 and 14: 516 W. H. MUNK, G. R. MILLER, F. E.
- Page 15 and 16: 518 W. H. MUNK, G. R. MILLER, F. E.
- Page 17 and 18: 520 W. H. MUNK, G. R. MILLER, F. E.
- Page 19 and 20: 522 W. H. MUNK, G. R. MILLER, F. E.
- Page 21 and 22: 524 W. H. MUNK, G. R. MILLER, F. E.
- Page 23 and 24: 526 W. H. MUNK, G. R. MILLER, F. E.
- Page 25 and 26: 528 W. H-. MUNK, G. R. MILLER, F. E
- Page 27 and 28: 530 W. H. MUNK, G. R. MILLER, F. E.
- Page 29 and 30: 532 W. H. MUNK, G. R. MILLER, F. E.
- Page 31 and 32: 534 W. H. MUNK, G. R. MILLER, F. E.
- Page 33 and 34: 00207'-0.C-0-01~~~~~~~~~~~~~~~~~~~~
- Page 35 and 36: 538714Cld0,9~~~~~~~U0CldCIO.0a.)a.)
- Page 37 and 38: 540 W. H. MUNK, G. R. MILLER, F. E.
- Page 39 and 40: 542 W. H. MUNK, G. R. MILLER, F. E.
- Page 41 and 42: 544 W. H. MUNK, G. R. MILLER, F. E.
- Page 43 and 44: 546 W. H. MUNK, G. R. MILLER, F. E.
- Page 45 and 46: 548 W. H. MUNK, G. R. MILLER, F. E.
- Page 47 and 48: 550 W. H. MUNK, G. R. MILLER, F. E.
- Page 49 and 50: 140? 1300 1200 1100 1000 900 80016t
- Page 51 and 52: ;554 W. H. MUNK, G. R. MILLER, F. E
- Page 53 and 54: 556 W. H. MUNK, G. R. MILLER, F. E.
- Page 55 and 56: 558 W. H. MUNK, G. R. MILLER, F. E.
- Page 57 and 58: 560 W. H. MUNK, G. R. MILLER, F. E.
- Page 59 and 60: 562 W. H. MUNK, G. R. MILLER, F. E.
- Page 61 and 62:
564 W. H. MUNK, G. R. MILLER, F. E.
- Page 63 and 64:
566 W. H. MUNK, G. R. MILLER, F. E.
- Page 65 and 66:
568 W. H. MUNK, G. R. MILLER, F. E.
- Page 67 and 68:
570 W. H. MUNK, G. R. MILLER, F. E.
- Page 69 and 70:
572 W. H. MUNK, G. R. MILLER, F. E.
- Page 71 and 72:
574 W. H. MUNK, G. R. MILLER, F. E.
- Page 73 and 74:
576 W. H. MUNK, G. R. MILLER, F. E.
- Page 75:
578 W. H. MUNK, G. R. MILLER, F. E.
- Page 78 and 79:
Munk et al. Phil. Trans A, volume 2
- Page 80 and 81:
582 W. H. MUNK, G. R. MILLER, F. E.
- Page 82:
584 W. H. MUNK, G. R. MILLER, F. E.