Directional Recording of Swell from Distant Storms - Department of ...
Directional Recording of Swell from Distant Storms - Department of ...
Directional Recording of Swell from Distant Storms - Department of ...
Create successful ePaper yourself
Turn your PDF publications into a flip-book with our unique Google optimized e-Paper software.
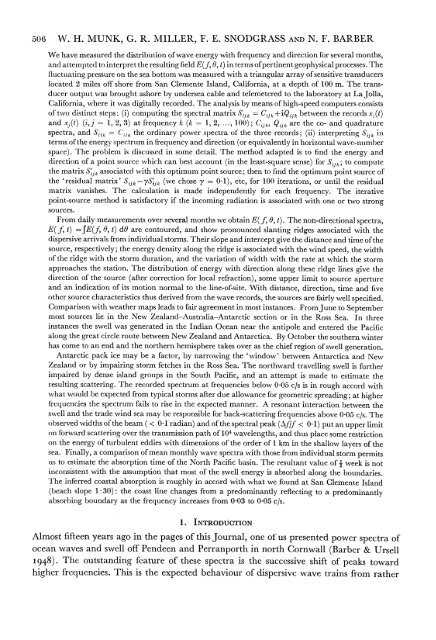
506 W. H. MUNK, G. R. MILLER, F. E. SNODGRASS AND N. F. BARBERWe have measured the distribution <strong>of</strong> wave energy with frequency and direction for several months,and attempted to interpret the resulting field E(f, 0, t) in terms <strong>of</strong> pertinent geophysical processes. Thefluctuating pressure on the sea bottom was measured with a triangular array <strong>of</strong> sensitive transducerslocated 2 miles <strong>of</strong>f shore <strong>from</strong> San Clemente Island, California, at a depth <strong>of</strong> 100 m. The transduceroutput was brought ashore by undersea cable and telemetered to the laboratory at La Jolla,California, where it was digitally recorded. The analysis by means <strong>of</strong> high-speed computers consists<strong>of</strong> two distinct steps: (i) computing the spectral matrix Sijk = Cijk+iQijk between the records xi(t)and xj(t) (i,j = 1, 2, 3) at frequency k (k- 1, 2, ..., 1]00); Cijk, Qijk are the co- and quadraturespectra, and -Siik CLiik the ordinary power spectra <strong>of</strong>' the three records; (ii) interpreting Sijk interms <strong>of</strong> the energy spectruim in frequency and direction (or equivalently in horizontal wave-numberspace). 'T'he problem is discussed in some detail. The method adapted is to find the energy anddirection <strong>of</strong> a point source which can best account (in the least-square sense) for Sijk; to computethe matrix S'k associated with this optimum point source; then to find the optimum point source <strong>of</strong>the 'residual matrix' Sijk.- YS'J (we chose y = 0-1), etc, for 100 iterations, or until the residualmatrix vanishes. The calculation is made independently for each frequency. The iterativepoint-source method is satisfactory if the incoming radiation is associated with one or two strongsources.From daily measurements over several months we obtain E( f, 0, t). The non-directional spectra,E( f, t) =fE(f, 0, t) dO are contoured, and show pronounced slanting ridges associated with thedispersive arrivals <strong>from</strong> individual storms. Their slope and intercept give the distance and time <strong>of</strong> thesource, respectively; the energy density along the ridge is associated with the wind speed, the width<strong>of</strong> the ridge with the storm duration, and the variation <strong>of</strong> width with the rate at which the stormapproaches the station. The distribution <strong>of</strong> energy with direction along these ridge lines give thedirection <strong>of</strong> the source (after correction for local refraction), some upper limit to source apertureand an indication <strong>of</strong> its motion normal to the line-<strong>of</strong>-site. With distance, direction, time and fiveother source characteristics thus derived <strong>from</strong> the wave records, the sources are fairly well specified.Comparison with weather maps leads to fair agreement in most instances. FromJune to Septembermost sources lie in the New Zealand-Australia-Antarctic section or in the Ross Sea. In threeinstances the swell was generated in the Indian Ocean near the antipole and entered the Pacificalong the great circle route between New Zealand and Antarctica. By October the southern winterhas come to an end and the northern hemisphere takes over as the chief region <strong>of</strong> swell generation.Antarctic pack ice may be a factor, by narrowing the 'window' between Antarctica and NewZealand or by impairing storm fetches in the Ross Sea. The northward travelling swell is furtherimpaired by densc island groups in the South Pacific, and an attempt is made to estimate theresulting scattering. The recorded spectrum at frequencies below 0 05 c/s is in rough accord withwhat would be expected <strong>from</strong> typical storms after due allowance for geometric spreading; at higherfrequencies the spectrum fails to rise in the expected manner. A resonant interaction between theswell and the trade wind sea may be responsible for back-scattering frequencies above 0 05 c/s. Theobserved widths <strong>of</strong> the beam (< 0-1 radian) ancd <strong>of</strong> the spectral peak (tAf/f < 0.1) put an upper limiton forward scattering over the transmission path <strong>of</strong> 104 wavelengths, and thus place some restrictionon the energy <strong>of</strong> turbulent eddies with dimensions <strong>of</strong> the order <strong>of</strong> 1 km in the shallow layers <strong>of</strong> thesea. Finally, a comparison <strong>of</strong> mean monthly wave spectra with those <strong>from</strong> individual storm permitsus to estimate the absorption time <strong>of</strong> the North Pacific basin. The resultant value <strong>of</strong> j week is notinconsistent with the assumption that most <strong>of</strong> the swell energy is absorbed along the boundaries.The inferred coastal absorption is roughly in accord with what we found at San Clemente Island(beach slope 1:30): the coast line changes <strong>from</strong> a predominantly reflecting to a predominantlyabsorbing boundary as the frequency increases <strong>from</strong> 0 03 to 0 05 c/s.1. INTRODUCTIONAlmost fifteen years ago in the pages <strong>of</strong> this Journal, one <strong>of</strong> us presented power spectra <strong>of</strong>ocean waves and swell <strong>of</strong>f Pendeen and Perranporth in north Cornwall (Barber & Ursell1948). The outstanding feature <strong>of</strong> these spectra is the successive shift <strong>of</strong> peaks towardhigher frequencies. This is the expected behaviour <strong>of</strong> dispersive wave trains <strong>from</strong> rather


